Let’s be honest, building reports probably isn’t your favorite part of the job (especially when the numbers aren’t great). But they are essential to monitoring the progress of your KPIs, and comparing data on a monthly and yearly basis. With so many different metrics and data points to analyze, it can be difficult to figure out exactly what needs to be included in a PPC report, and why.
In this post, we’ll look at a few tools to help you create reports, the exact metrics you should be tracking, how to set up a PPC report, and some screenshots of our reports and KPI dashboards.
PPC Reporting Software and Tools
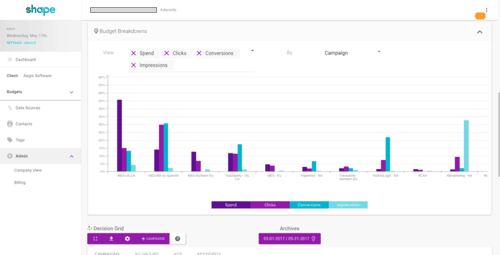
- Shape – A great tool to help manage budgets across a number of different advertising platforms. Allows you to set limits on spending (will automatically pause campaigns when the limit is reached), and also helps manage PPC campaigns. It has a dashboard for reporting as well that automatically pulls all of the data you request.
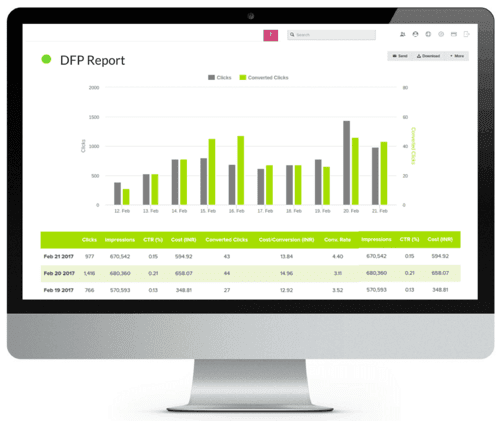
- Report Garden – This software is strictly for reporting, and allows you to build out some pretty beautiful reports. It syncs right with your Google Adwords and Google Analytics, and visually represents the data that you choose (you can customize metrics to track as well).
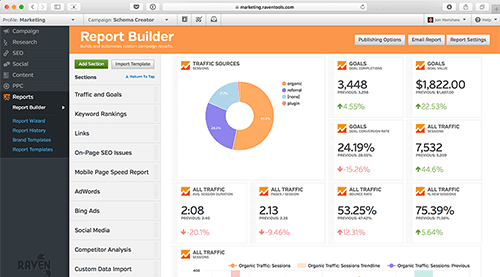
- Raven Tools – Another handy management tool and report creator. While Raventools main sell is their SEO capabilities, they also have PPC reporting build into their dashboard as well. You can create branded reports and allow “read only” access to internal team members who may not have full access to the software.
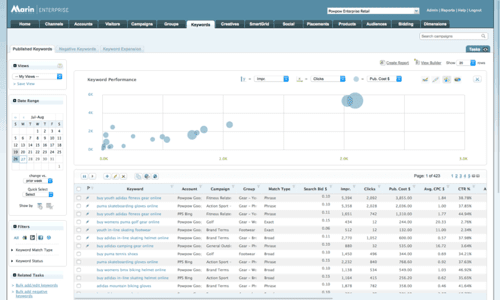
- Marin Software – Marin focuses mostly just on Social and Display advertising campaigns, but much like the software tools above, it also syncs with all of your ad campaign data for easy to create reports.
Getting Started: What are you trying to accomplish?
Before you create your PPC report, it’s important to clearly understand and lay out your goals and objectives. Obviously, the overall goal is to increase revenue and see a positive ROAS from your ad campaigns, but you can have different “mini-goals” to help hit the overall goal of growing revenue. Some examples of monthly goals and objectives in the B2B space could include:
- Increasing the number of Marketing Qualified Leads (MQLs) in your pipeline
- Lower Cost per Acquisition (CPA)
- Higher Conversion Rate
- General Brand Awareness (increase in direct website visits or brand searches)
In this article, I’m going to be focusing on creating a PPC report with the overall goal of increasing the number of Marketing Qualified Leads. Once you’ve determined the monthly goals you’re trying to work for, it’s important to lay out the weekly sprints or tests to hit those goals. Each week you should determine new tests to help you accomplish the monthly goal. From there, set up daily inputs to help complete the weekly tests. We have checklists for all of our PPC teams to do on a daily basis. For every account each week we:
- Ask senior consultant if client is getting quality leads (and turning those leads into sales) each week
- Review spend and make sure it’s on budget for the month
- Check all keyword’s cost per click
- Check for conversions and optimize keywords and landing pages
- Review quality scores
- Review impressions shares and average positions
- Mine search query reports for new opportunities
- Add new keywords
- Add negative keywords
- Check ad copy performance and make changes as necessary
- Pause losing ads
- Write new ad copy
- Check extensions performance
- Make bid adjustments
- Fix key issues
- Analyze landing page results from radical split tests
- Launch a new campaign or test
- Write weekly PPC update
These daily inputs are necessary for a successful campaign, and allows our PPC teams to continuously make steps forward and grow our client’s campaigns.
What Metrics Should we be Tracking?
Every PPC campaign comes with a plethora of different metrics, and some are definitely more important than others. When it comes to a PPC report where the goal is to increase the number of marketing qualified leads, we track the following metrics.
- Cost per Conversion – Your total ad spend divided by the amount of conversions (i.e. download a white paper, fill out a contact form, etc.)
- Conversion Volume – How many conversions you got in that month. Good for identifying seasonal trends and comparing month over month and year over year data.
- Conversion Rate – The total number of people who clicked on your ad divided by the number of people who converted.
- Conversion Value (if ecommerce or if you have an average value based on close rate): This is fairly easy to calculate for an ecommerce client. If you’re not, you can take the average lifetime value of a customer and multiply that by your close rate to assign a conversion value.
- Cost – How much total spend went into your ads.
- Search Impression Share – The percentage of impressions your ads receive compared to the total number of impressions that your ad COULD get. It highlights if your ads could reach more people by increasing your bid or budget.
- Click Through Rate – The total number of people who saw your ad divided by the number of people who clicked. According to Wordstream, the average CTR is around 2%.
- Impressions/Clicks – Essentially just the numbers behind click through rate. If your conversions are low, but your conversion rate is high, you probably need to expand your keyword targeting or add more broad match modifiers to get more impressions.
- Cost per Click – The total spend of your ad divided by the number of clicks.
- Average Position – The position on the SERP (search engine results page) that the ads appear on. There are 4 spots above the #1 organic result (top of the page), and 3 spots below the #10 organic result (bottom of the page).
These are the metrics we track to give us a complete picture of how our ads are performing.
Setting up a PPC Report
We always start our PPC reports with the highlights (I was always a good news first kind of guy anyways). Specifically, we want to let our clients know how many conversions they had from paid campaigns, and what the cost per conversion was. This is an overview for all platforms we’re advertising on (Google Adwords, Bing Ads, Social and Third Party Review Sites such as Capterra, Software Advice, etc.). We then include screenshots of our individual platforms to compare them against each other.
Here is a basic overview of how our PPC monthly reports are formatted:
Intro Overview + Highlights
“We had a record breaking month in paid advertising in the month of March. Our overall conversions increased from 114 to 238 (+109%) and our cost per conversion for MQLs dropped from $370 to $107 (-71%). Although we spent more this month, our CPA is still well under our 2017 objective of $250 which is a good indicator that our recent optimizations are producing solid results. Below is a visual of conversion metrics by channel for the month of March.”


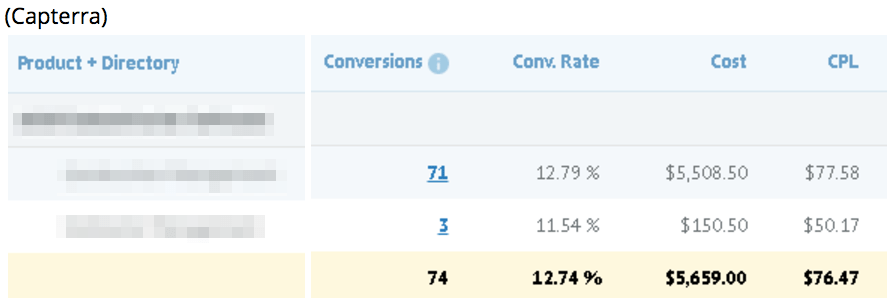
“We can attribute our large success in increasing lead volume to our standout Bing search and Adwords Display campaign performance. As noted in our most recent discussion, we’ve updated all display campaign location targeting to strictly the United States, which will likely produce lower display campaign conversion volume, but increase lead quality. We will continue utilizing Facebook advertising as a means of generating targeted brand awareness and driving new conversions. Although we were unable to produce any Facebook conversions this month, our Facebook ads reached over 82,742 users (+70% MoM) and produced 410 link clicks (+40% MoM) at the low average cost per click of $0.96.”
Next Steps
“We are seeing success with recent campaign expansions and intend to further optimize our 2 newest search campaigns, our Solution and Features campaign and Industry Specific campaign. Because of our new expansions, our daily budgets are being met much faster, requiring us to keep a closer eye on search term reports to find new negative keywords. Our next immediate steps in the coming weeks will be to briefly pause our expansion efforts and focus on tightening our search term reports and ad groups to drive down cost per conversion.”
When we’re creating reports for our clients, the actual text is more of a light summary, and we let our KPI spreadsheets tell the real story on the performance of our ads. We link this KPI spreadsheet to all of our clients in their monthly reports. Below are screenshots of our KPI dashboards, and the things that we track on a monthly basis for our PPC campaigns.

An overview of the KPIs we track for our PPC Campaigns (across all channels)
We give a broad overview of our campaigns. Our KPIs for this client are how many MQLs we’ve gained from our campaigns, how many of those MQLs went through to legitimate opportunities, and the Revenue created from these opportunities.
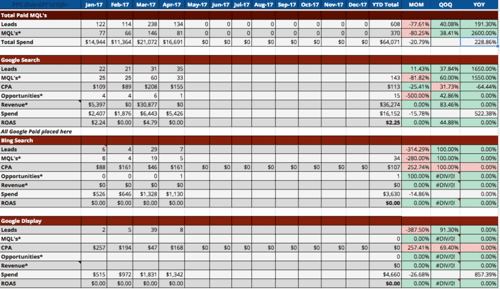
The top half of our breakdown of each individual channel we’re advertising on.
We also want to include historical data of all of our campaigns across different advertising channels as well, so we can track patterns and predict revenue for certain seasons and months. These are the first three channels we’re advertising on. Below are the bottom four.

The bottom half of our spreadsheet for tracking KPIs across all advertising channels
We include these spreadsheets for our numbers and data driven clients, but we also highlight month over month trends for the more visual thinkers with the following graphs.

Month over month visualization of marketing qualified leads
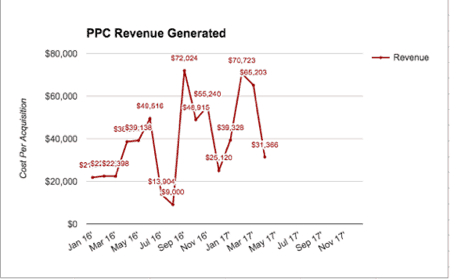
Month over month visualization of revenue from PPC campaigns
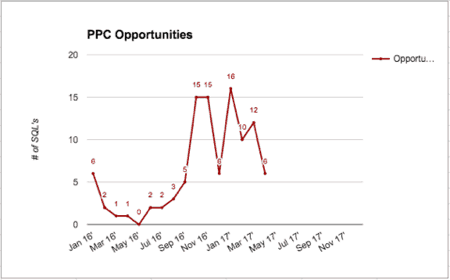
Month over month visualization of sales qualified leads
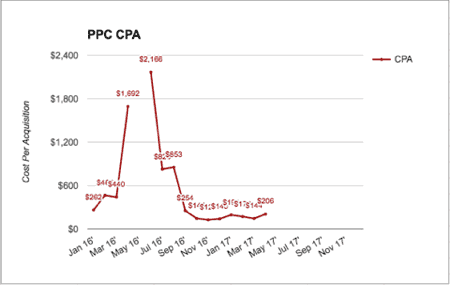
Month over month comparison of cost per acquisition
Conclusion
Gathering all of your PPC data and organizing it into a concise and digestible report (for your clients if you’re an agency, or for upper management if you work in-house), is crucial. Showing justification of your success can lead to increases in budget and more flexibility to test new advertising avenues. It can also help point out trends when things like leads and revenue are down.
If you’re already running PPC campaigns you should have a clear idea of what the goals are. But if you’re just starting, that’s the most important thing to determine before getting started. Hopefully this article helps shed some light on the different metrics to be tracking, and the best way to arrange that data to help drive strategy in the future.
If you’re a B2B company struggling with your PPC campaigns, we’d love to take a look with a free audit. We’ll highlight opportunities of growth, ways you’re wasting spend, and next steps for the future. Fill out our form to get started here!
-
Andrew Choco
Did you enjoy this article?
Share it with someone!

