Search engine users are not generally known for the lengthy attention spans. The truth is that you only have a matter of seconds to grab your user’s attention and hold onto it. And, even when everything goes well, you only have a brief moment to convert your user into a lead. Timing is everything.
Speaking of timing, make sure you download your copy of the Directive Site Speed Spreadsheet before reading the rest of this post.
In a world of fast-paced streaming and instant downloads, making your user wait for your page to load can be fatal.
How fatal? Well you can look at the numbers to see.
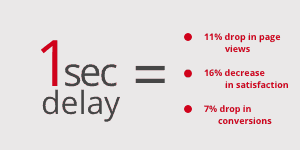
That’s right. A single second lag in your page’s load time can cost you serious conversions. More than that, it can shoot your Bounce Rate through the roof.
A slow load speed can be especially troubling if you’re trying to lower your bounce rate. The laggy load time can deter users from seeing any of the new changes to your site. If you are still working with a load time in the 4-5 second range, your conversion-rate optimization (CRO) efforts don’t get the time to shine…literally.
Optimizing your user’s on-page experience only works if you can get them to your page without bouncing off. For example, you can’t tell if your new header is working if your users get so frustrated with waiting that they bounce off before they see it.
Why Does Site Speed Matter?
I’ve already mentioned how a second’s lag in load-time can cost you conversions. But there are two primary reasons behind this problem. The first is obvious: the high Bounce Rate.
Generating the conversions you are looking for with a laggy home page is going to be difficult. Simple as that. A Crazy Egg stat from 2014 states that 57% of users will bounce off a page if it takes longer than three seconds to load. And that was three years ago – nearly an eon when it comes to internet speeds.
But beyond a daunting bounce rate, a slow load speed can even cost you with the users who stick around to see your home page. Regardless of whether or not they make it through the initial load time – a slow load speed sets a bad precedent for your user’s on-site experience. Why is this?
Because first impressions matter.
Especially in the B2B space, presenting a clean, efficient, and enterprise-level brand throughout the buyer’s journey is a must. And yes – the little things do matter. As my CEO once told me when editing a piece of client-facing content:
It doesn’t matter how hard you work on it. If there is even one piece of crap in an ice cream cake, your customer ain’t eating it.
If your home page is frustrating users by making them wait. Just imagine the psychological state you’ve created for the rest of your site. You may have created loads of amazing and insightful content. But if they are starting each page with a five second load time, your user is beginning each new on-page experience with a sigh. That’s not the mood you want them in while they read your content or consider converting.
Your home page is supposedly the easiest and simplest page to navigate. If a user has to wait 5 seconds to see your hero shot, they probably won’t bother clicking a download link or trying to watch any videos on your resource page. Your slow load time has put the user on edge for the rest of their on-site experience.
Now your load time is costing you initial traffic and compounding to cost you conversions as well. It’s about time you start optimizing your page speed for a swift and smooth on-page experience. Let’s take a look at how to test, grade, and optimize your site speed.
How to Test Site Speed (Industry Tools)
You can login to Google Analytics to get a baseline of how fast your site is loading. Just open up your GA account for the specific site you are testing and open the Behavior tab on the left. Then click through to Site Speed, and check out the Overview report.
It should look something like the screenshot below:
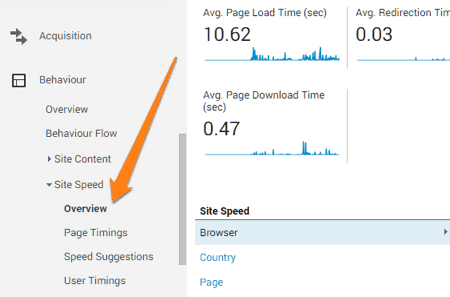
You can also check out the Page Timing sections to compare individual page’s load speeds to your overall speed. This will tell you if you have any features on certain pages that are specifically hampering your load speed.
On top of GA, there are plenty of industry trusted tools that can help you test and optimize your site speed. The results usually aren’t as granular or accurate, and you can’t compare your specific pages to your overall load time. But these sites still give you plenty of useful data to work with.
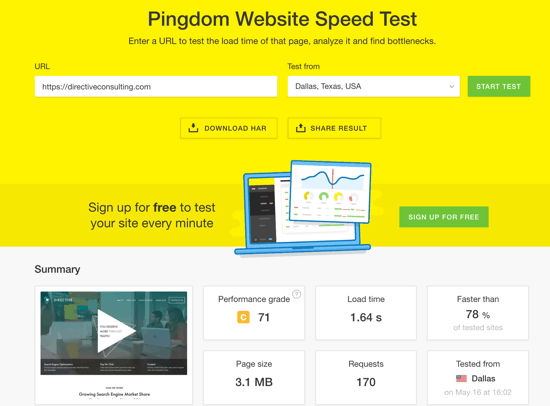
- Pingdom – *hint hint* – this is the tool we used for our Spreadsheet – another great tool for grading site speed, performance, and analyzing which aspects of your page are causing problems.
- Load Impact – Site speed tester that replicates real visitor recordings on your site to see how your pages perform. Load Impact’s strength comes from its charts that show you different traffic and engagement distribution.
- GTMetrix – a great tool that pulls site speed data from multiple sources to give you an aggregate grade (A-F). GTMetrix will also give you a list of action items to get your optimization started.
- Dotcom-Monitor – interesting tool that will show you page load times for your site from a variety of locations. Great for identifying when the issue is external or internal.
- Webpage Test – fairly basic testing tool that allows you to test pagespeed from different devices, services, and locations.
So, now you know what we are tracking and what tools we used to track it, let’s look at the results – shall we?
Don’t forget to download you free version of the Directive Site Speed Spreadsheet to see if your site’s load time is costing you valuable conversions.
The Results: Grades “A” Through “F”
Pingdom is a great tool for running site speed tests and analytics because it gives you a overall diagnosis of your site speed right off the bat. You can actually signup for their software to run continuous site speed analytics on your site. But for those of you just looking for a single number to improve, their free tool is fine.
You can check out the tool by clicking on the screenshot below.

As you can see in the screenshot, Pingdom let’s you test your site speed from different locations. This is really helpful especially if you’re managing a national campaign that is targeting larger cities in different locations. This locations pull their data from different servers, so you may be laggy some places and on-point in others.
For the sake of consistency, we ran all the sites through Pingdom and tested their site speed from Dallas, Texas. We chose a city that was fairly centralized within the continental United States. This way, all the site we tested (which are all US based) were being held to the same reference point.
Now, there are five main metrics that Pingdom will give you for your site speed grade.
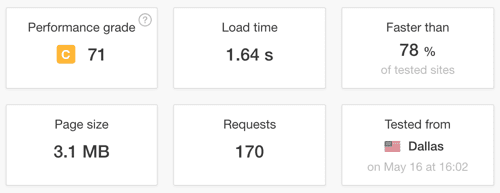
The first is pulled straight from the Google Dev team. It tells you your exact Google Page Speed score. Like all Google metrics, this is an algorithmic calculation of many factors – but it’s a good place to start.
Next they’ll show you the exact load time for the specific test you just ran. What’s really helpful is that it will also give you a percentage of the sites tested through Pingdom that you’re faster than. While the whole digital market hasn’t been pulled through Pingdom, it’s still a nice comparison metric to see how you’re stacking up.
The last two metrics are Page Size and Requests. These stats are more helpful as they can give you insights into how you can actually improve your load time. The first two metrics are simply grades – these are potential diagnoses. Here’s why:
- Your Page Size usually directly correlates to the load speed of that given page. The larger your page is (in megabytes) the longer it will take to load. If you see your Page Size is inordinately large, your home page may have too much custom design features or too many media files. Consider trimming
- Requests will tell you how many different files had to be downloaded in order to load the page in its entirety. Again, the higher this number is, the more likely you are to run into page speed issues. Make sure you manage your files efficiently to make indexing and navigating your site quick and easy
Pingdom will give you a lot more than just five numbers reporting on your site speed. If you keep scrolling down the page it will give you a breakdown of the analysis. It will also give you a list of Performance Insights that you can turn into a list of action-items to start optimizing your page speed.
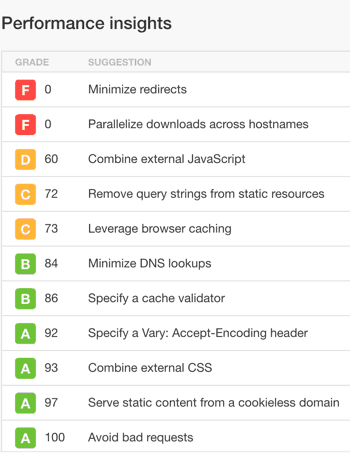
After all is said and done, Pingdom will take all the data its accumulated and calculate a grade for your site. What’s interesting about this grade is that load speed (even though it’s one of the five big metrics) isn’t quite directly correlated. Some sites with drastically different load times have the same grade.
This means that this metric is taking multiple factors into account. So, let’s see what we can learn from the range of scores in our sample.
“A”: Pats on the Back for You
Of all the US computer hardware sites we entered into Pingdom, only six reported a site grade of “A”. Here are the big winners for you to check out.

These pages load pretty much immediately. In tech-speak, these would be considered “instant response” pages. Which is the end-goal when it comes to site speed optimization. The more seamless your on site user experience, the more at-ease your user will be. A comfortable user is a trusting user – and a trusting user is a conversion waiting to happen.
What’s interesting about these pages is that they all six are quite unique design-wise. Opticon has the fastest load time – pats on the back for breaking into the milliseconds – but has a very minimalist page so the fast load time isn’t shocking. Pingdom only reported 26 requests from this page, which means that with all the links, images, and files only 26 different features had to load to form the page. Now, that’s a clean design. But keep in mind that it may leave your on-site experience a bit lacking.
On the other hand, ColorSpan has the slower load time with an equally minimal design. Here, it’s important to make the distinction between “minimal” and thin/sparse.

Opticon’s site may be minimal, but it is focused and has a clean, customer journey mapped out. ColorSpan you can’t even finish reading the copy in the bottom right hand corner.
Also, with gigantic hero shots with not CTA, it’s safe to say that this site isn’t closely monitored for on-page optimization. We can assume that the images most likely aren’t compressed, which could seriously hamper load time. But, because there are so few assets, the grade is still an “A.” This just goes to show that not every metric is iron clad.
Analysis requires context and comparison to yield actual insights.
As a general diagnosis, however, when it comes to pagespeed these sites are good to go and can focus their CRO efforts on their copy and design features. So long as your site speed is in the green, you can focus your optimization efforts on delighting your users.
“B”: Big Room for Improvement
The second tier of results has a much larger sample size. With 37 different sites with a “B” grade, there is far more variety in the types of sites we are examining now.
These sites, for the most part, are dealing with load speeds in the 1-3 second range. With a few outliers that got under the one second line and a few outliers that are dragging across the finish line with 6-8 second load speeds.
Outliers aside, a second or two in lag doesn’t seem like the end of the world. You’d think that you can at least count on the user sticking around to the count of three before they consider bouncing off your site. But, the statistics prove otherwise.
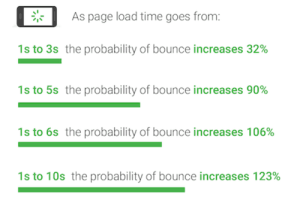
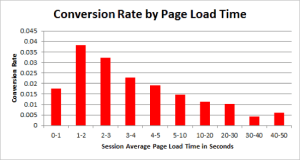
That’s right. For every second you add to your load speed you drastically increase the odds of users bouncing. But, what’s most interesting about the graph above, is the leap between the 1-3 second and 1-5 second ranges. This jump nearly triples the likelihood of users bouncing. While adding another second after the initial five only adds about ten percent. Why is that?
Because there is a general three second threshold of load time.
At or below three seconds you are dealing with potential CRO. But once your load time climbs above five seconds the only people you are keeping on site are users who are undeterred by lag. So another second or two after the initial five isn’t scaring anyone off.
Because of this – these sites in the “B” and “C” range are the real gold mine of insights. As they have load times that fall within the most volatile range of results.
“C”: Huge Value in Site Speed Optimization
So what trends can we see from this volatile sample size? and what optimization opportunities can we identify in order to improve these sites?
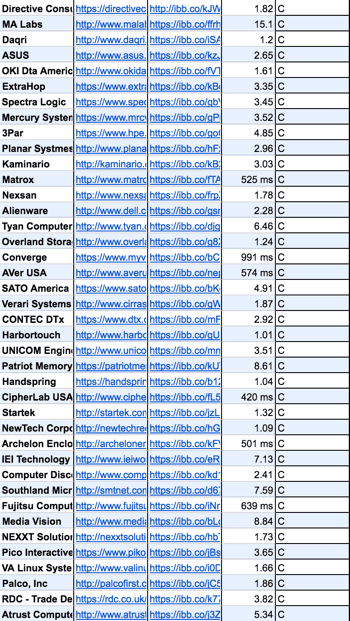
As you can see from the screenshot above, the “C” range of results has a wide variety of load speeds – just like the “B” range. With 39 results in the “C” and 37 in the “B” range, insights are hard to come by with such wide-varying results.
But after some comparison analysis, I’ve found the key differences between the two ranges:
- Wasteful Copy – the on-page copy is taking up a large amount of space on your page. Especially if the copy isn’t broken up into separate blocks in your wireframe, these giant copy chunks can take a while to load. Beyond that, large paragraphs increase friction. They aren’t easily read and so it’s less likely that your user readers every word. The more friction a page has, the lower your grade will be.
- Product Displays – a majority of page speed issues occur when different images or files need to load for the same page. Because of this, product pages need to be handled with care. Product Displays at the bottom of the home page is a great way to encourage on-site purchases from new visitors. But, if you aren’t careful, the product display can add some serious lag to your page. Make sure any images and files you use are properly compressed to avoid any lag. And make sure you present the products in an easily navigated format like a Slider.
- Image Hosting – lastly, image hosting can play a big part in defining your page speed and load time. Keep in mind that where/how you decide to store your images and files will affect their load time. If you are storing all your files on your site’s media library it may have to index the library to find the proper files. This can take time. To make sure your image formatting or hosting isn’t costing your leads, compress your images and organize their file names for easier indexation. You can also invest in a CDN or server side caching to clear up space and cut down load time.
Now, these don’t go for every site on the spreadsheet. But, for the most part, sites in the C range with a similar load speed as in the B range have been given a lower grade due to one of the above three issues.
If you find your site in the “C” range but still have a good load speed – these are the problems you need to fix. Optimizing these three features of your page should not only improve your load speed, but should raise your Site Speed Grade regardless.
On top of that, cleaner copy, product displays, and image hosting will give your site a more professional appeal. As I said before, the smoother the on-site experience, the more likely your user is to convert.
“D” & “F”: You Have a Problem with Bounces
For the most part, the sites that reported a grade of “D” or lower are dealing with serious loading issues. That’s not to say that these sites are shoddily built or anything like that.
There is plenty of quality in the lower echelons of this spreadsheet. But, these sites at the bottom of the list tend to have let their design appetites outreach their stomach. You often run into pages with such a low Site Speed Grade when the pages are custom design or using complex media/imagery in their hero section.
These pages are intensely customized and create an incredibly unique user experience – which is a powerful brand force. But the truth is that all that hard dev work isn’t worth it if nobody is seeing it. You can see in the screenshot below that, as an image, the home page is a clean and unique experience.

However, if you were to actually visit the site you’d quickly (or not so quickly) notice that the “cool” images and effects of the page are hampering the actual functionality. It takes forever to load and even scrolling has a delay to it.
Make sure that any CSS or design features are properly compressed and aren’t slowing down your site with a massive load time. To truly invest in Conversion Rate Optimization, it’s first necessary that you cut down your BR to be more manageable.
To start converting users, you need to first ensure that the majority of them are at least staying on your site.
Here’s a rule of thumb to remember when investing in complicated dev work:
It doesn’t matter how nice a car’s paint job is. If it doesn’t start, chances are you’re not driving it off the lot.
Three Tactics to Optimize Site Speed For a Lower Bounce Rate
So I’ve spent the last 3,000 words or so rambling about why you need to optimize your site speed and what common problems most sites run into. It’d be nice if I told you how to fix all these potholes I’ve pointed out – huh?
Don’t worry, I’m not leaving you out to dry in the rain. Below are three tactics you can implement in your own campaigns to optimize your sites’ page speed. Some are simple, some are a bit more expert-level. But the end goal is the same – clean up how your site hosts, finds, and displays your content to users.
Compressing Assets from the Onset
Different image, text, video, and other asset files can take up a lot of space. If you don’t know how to manage your files in your media library, you will constantly be dealing with page speed issues. Compressing and organizing your files from the onset has multiple benefits:
- Make managing your media library easier
- Alt text and meta descriptions prime page for better ranking
- Compressed file size cuts down page speed/response time
Compression goes beyond just your media library, as well. Enabling compression for your actual HTML will also help your page speed. Enabling compression can decrease the size of certain files by up to 90%, which means that when your site requests a file from the server, the transaction is far faster. Which means your site can show your user the file that much faster as well.
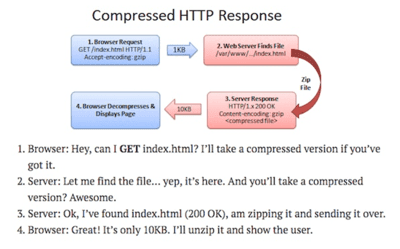
You can read a more in depth explanation of compression in this Instapage post on “Interpreting Google PageSpeed Insights.”
Content Delivery Networks (CDNs)
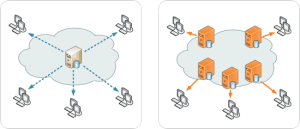
So, what exactly is a CDN? Content Delivery Networks work by by providing multiple, alternative servers to host static files – as opposed to relying on the primary server that may be far away geographically.
By distributing your data and files via a CDN, you pull your files from different servers that are more localized to the specific user’s location. This way it takes less time to load the same image from a closer CDN than it would pulling the file from the primary server.
If you are looking to choose a CDN for your site, here is a super helpful piece from Radware on the “11 Commonly Asked Questions (And Answers) About CDNs”.
Minify Your HTML/CSS/JavaScript
Optimizing site speed means cutting the fat from whatever features your site has to load. “Minifying” your code to eliminate any redundant or unnecessary data is one more way to do this.
Now, I’m no coding expert. So the idea of manually combing through an entire website for HTML redundancies seems as unreasonable as translating Lao Tsu on my own.
Thankfully, there are some tools out there that will minify your code for you:
- For HTML code you can use the HTML Minfier
- You can use CSS Nano to minify custom CSS
- For those of you who use Javascript, UglifyJS2 will work fine
Regardless of which tool you use, you’ll want to clean up your code, your media library, and your servers to make them as efficient as possible. A clean and swift site is a smooth slide towards conversion.
Takeaways – Fastest Path From A to B
I started this post by mentioning that today’s users aren’t known for their attention spans. So, if you’ve made it to this point – bravo – here’s a gold star for you:

Remember that in the end the goal of our sites is to convert users into customers or leads. You want to make the path from your first interaction with your user to that conversion as short and fast as possible. The faster and smoother your site, the cleaning and more streamlined your conversion path will become.
Stop losing leads and money from a matter of seconds. And start optimizing your page speed to speed up your pipeline. Don’t forget to download your copy of the Directive Site Speed Spreadsheet to see if you’re fast enough for your leads!
-
CEO Garrett Mehrguth
Did you enjoy this article?
Share it with someone!


