Choosing between Google’s Looker Studio vs Tableau Desktop to help visualize data and drive insights for your next digital marketing campaign?
Data-driven marketers depend on business intelligence tools like Looker Studio and Tableau Desktop to help them organize and process data into actionable insights that drive marketing success. These tools come with a learning curve, but enable marketers to plug in multiple data sources, build dashboards, visualize & analyze campaign data in real-time and quickly produce reports to share with clients and colleagues.
To help you decide between Looker Studio vs Tableau Desktop for your business, we’ve created this in-depth comparison with details about each one. We’ll review the most important similarities and differences between Looker and Tableau Desktop to help you decide which one is best for you.
Comparing Google’s Looker Studio vs. Tableau Desktop
To make our comparison as equitable as possible, we’re focusing on the most important features that digital marketers need from their data visualization tool: simple integration and connection with data sources, robust data management capabilities, and user-friendly dashboarding/reporting.
We also want to highlight any unique features offered by either Tableau Desktop or Looker and compare pricing options/access requirements for both tools.
That gives us a total of five categories for comparison, to which we’ll assign equal weight in our standard 100-point scoring system.
- Connectors & Data Sources (20 points maximum)
- Data Management & Analysis (20 points maximum)
- Reports & Dashboarding (20 points maximum)
- Unique Features & Selling Points (20 points maximum)
- Pricing & Access (20 points maximum)
For each category, we’ll look at similarities and differences between Looker Studio vs Tableau Desktop and assign each platform a score out of 20 points. Next, we’ll tally up the scores and see which data visualization tool comes out ahead. Lastly, we’ll give our own recommendations for marketers choosing between the two platforms.
Looker Studio vs. Tableau Desktop: Connectors & Data Sources
App integrations are especially important for business intelligence tools that process data from external sources. Digital marketing agencies that leverage a 3-5 product (or more) marketing software stack will benefit most from the business intelligence platform that integrates with their existing software tools.
Before choosing between Looker Studio vs Tableau Desktop, marketers should make sure that they’ll be able to easily import and manage data from their existing marketing software tools.
Looker Studio offers what can only be described as a staggering amount of options for data connection. For starters, Looker integrates seamlessly with the Google marketing platform so you’ll be able to quickly pull data from your Google Ads account, Google Search Console, and Google Analytics.
On top of that, there are nearly 200 partner connectors spanning some of the most popular SEO and advertising platforms.
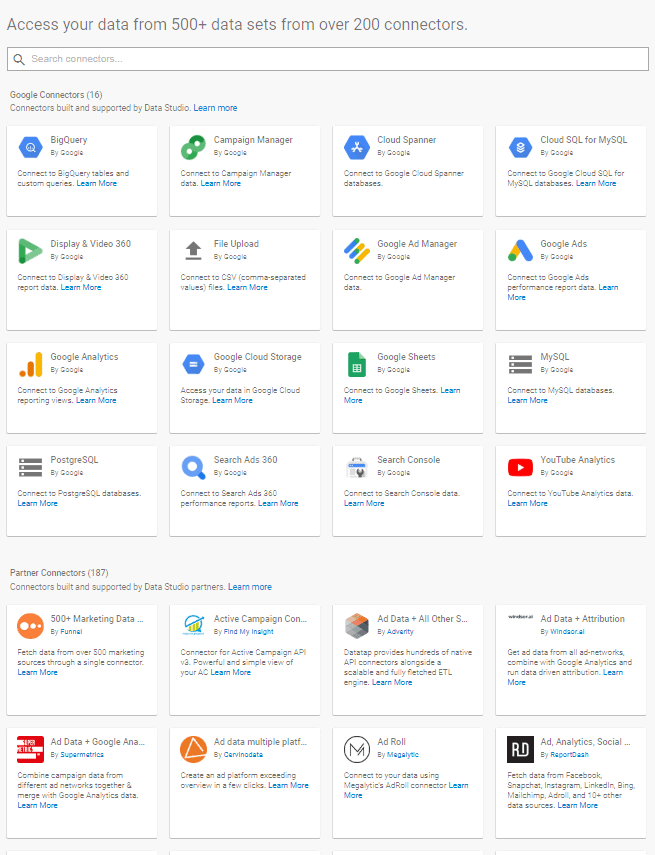
Image: Looker Studio Data Sources
The “500+ Marketing Data Sources” connector, built by Looker’s partner company Funnel is a free connector that lets digital marketers import data from over 500 different ad platforms into Looker Studio for analysis and visualization.
Tableau Desktop also offers connections to hundreds of data sources, but these integrations are mainly geared towards database software rather than marketing software. Digital marketers who rely on Tableau desktop for data visualizations may need to extract data from their marketing applications into a database before it can be imported into Tableau.
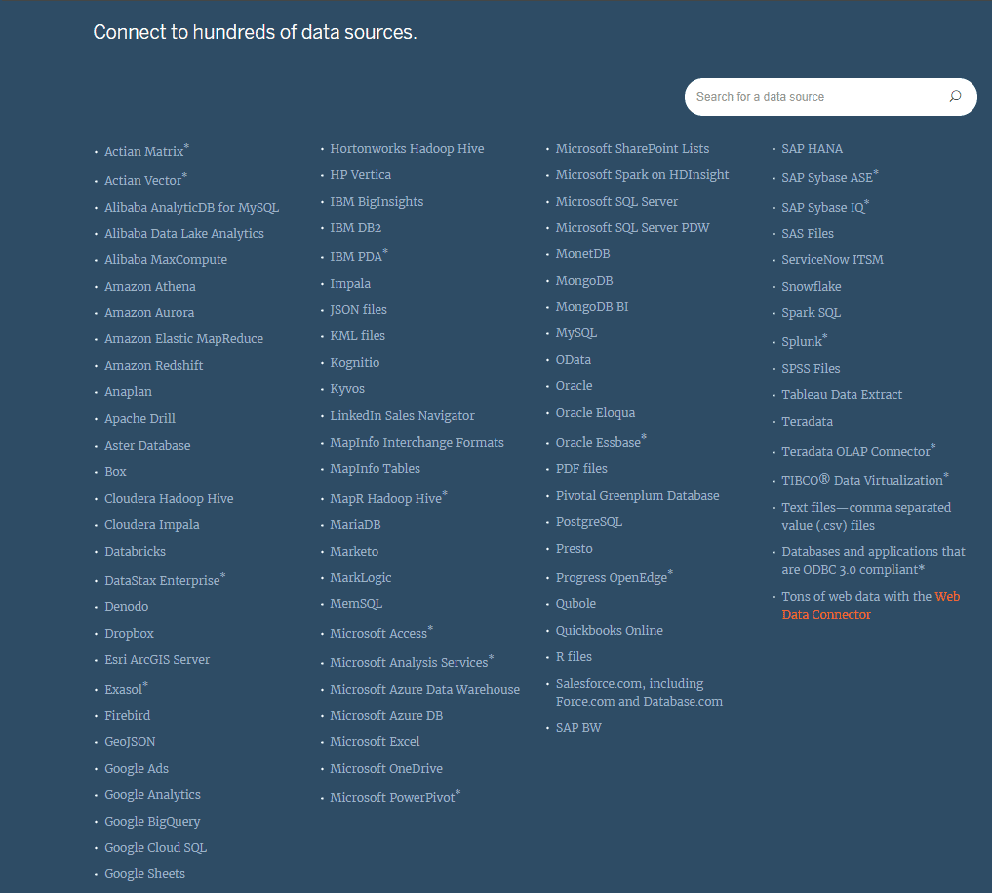
Image: Tableau Desktop Data Sources
In addition to the provided data connectors, Tableau created a web data connector that can connect to web-based HTML and Java data sources. Members of the Tableau community have programmed web data connectors for a variety of purposes and made them available to other users for free!
Score:
Looker Studio: 18/20
Tableau Desktop: 15/20
Before choosing either of these platforms, digital marketers should assess how their choice will impact workflows for data sourcing and management. Looker Studio offers plenty of web app integrations, but limited database integrations. With Tableau Desktop, you can import data from many types of databases, but there aren’t as many data connectors for marketing applications or advertising platforms.
Looker Studio vs. Tableau Desktop: Data Management & Analysis
Looker Studio and Tableau both offer tools and features that can help digital marketers manage and analyze their data before constructing a report.
In Looker, marketers can use the Data Explorer to combine field data from various sources into charts and graphs with a simple drag and drop interface. There’s a Blend Data function that can be used to combine data from multiple sources, and plenty of formatting options that can help drive insights.
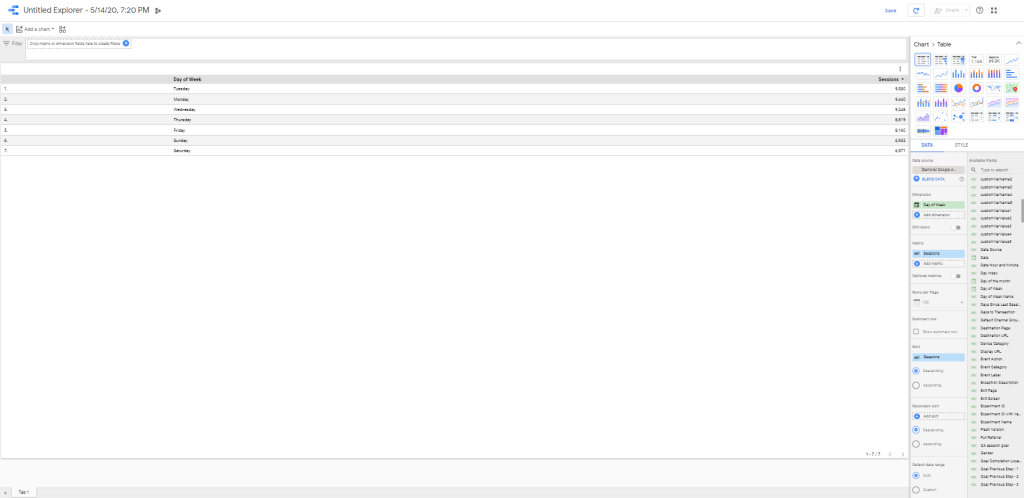
Image: Looker Studio Explorer Tool
Tableau also offers a simple drag-and-drop tool that makes it easy for digital marketers to create charts and graphs. The advantage of Tableau, however, is that it offers a separate Analytics tab where users can quickly apply box plots, quartiles, trend lines and other analytical features directly onto their graphs.
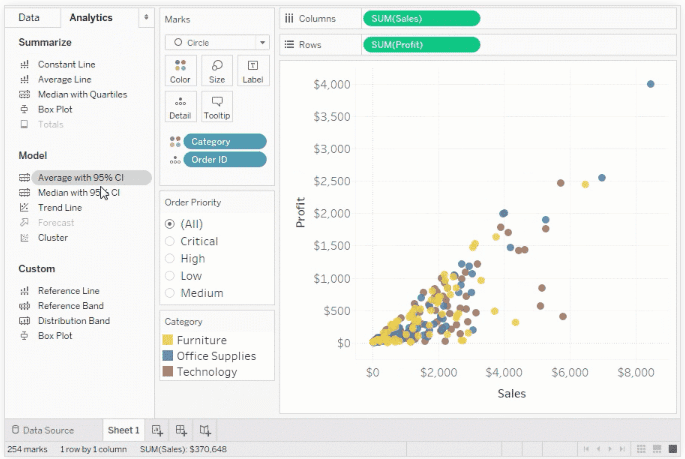
Image: Tableau Desktop Data and Analytics
Another amazing Tableau desktop feature is Tableau Prep. Tableau Prep is a new Tableau product that helps users streamline and automate the process of cleaning data before they perform in-depth analysis or construct a report.
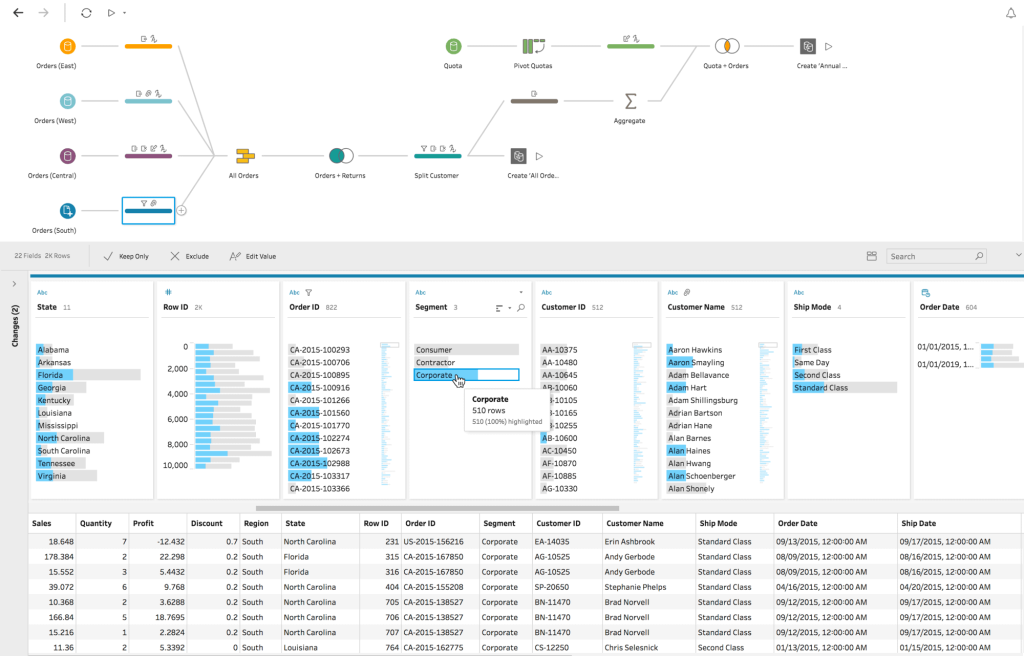
Image: Tableau Prep helps digital marketers organize and clean data sets before analysis & reporting
Score:
Looker Studio: 15/20
Tableau Desktop: 19/20
Google offers a data explorer and some data blending capabilities, but Tableau Prep and the Analytics tab make Tableau an all-around better choice for data analysis capabilities. Adding trend lines to graphs, calculating averages from a data set, and automating other statistical operations are high-value features for data-driven marketers.
Looker Studio vs. Tableau Desktop: Reports & Dashboarding
Reports are crucial for communicating results and challenges to clients and sharing information and success stories with colleagues. Looker Studio and Tableau each offer a simple drag-and-drop interface that makes it easy for digital marketers to customize reports.
Once you get over the learning curve, you’ll be able to quickly produce customized reports with data from a variety of sources using Looker Studio. Google provides data studio templates to help get you started and there are loads of third-party templates available through Looker and elsewhere on the Internet.
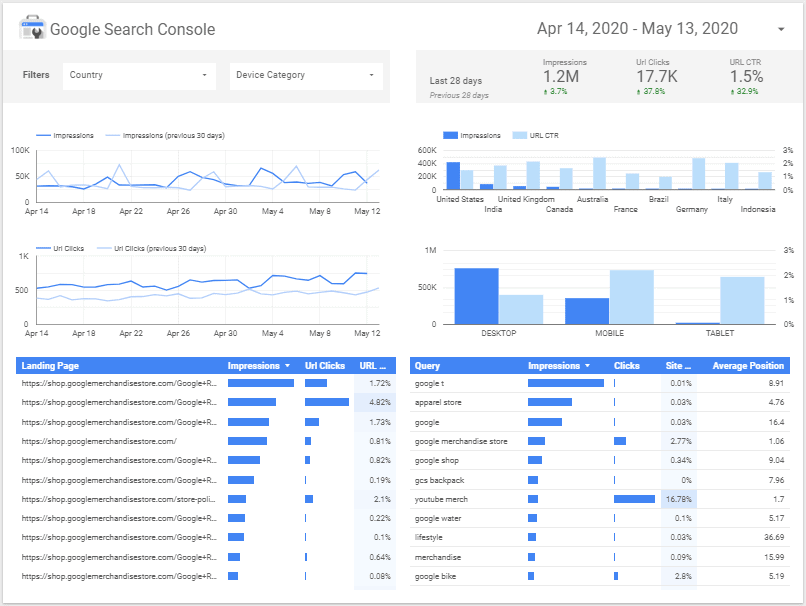
Image: Sample Looker Studio Dashboard
Tableau desktop also supports a drag-and-drop dashboard customization interface that streamlines reporting for marketing professionals and digital agencies. While the report creation process is user-friendly, there aren’t too many dashboard templates available. Tableau does offer Dashboard Starters for users working with Salesforce, Oracle Eloqua, Marketo and ServiceNow.
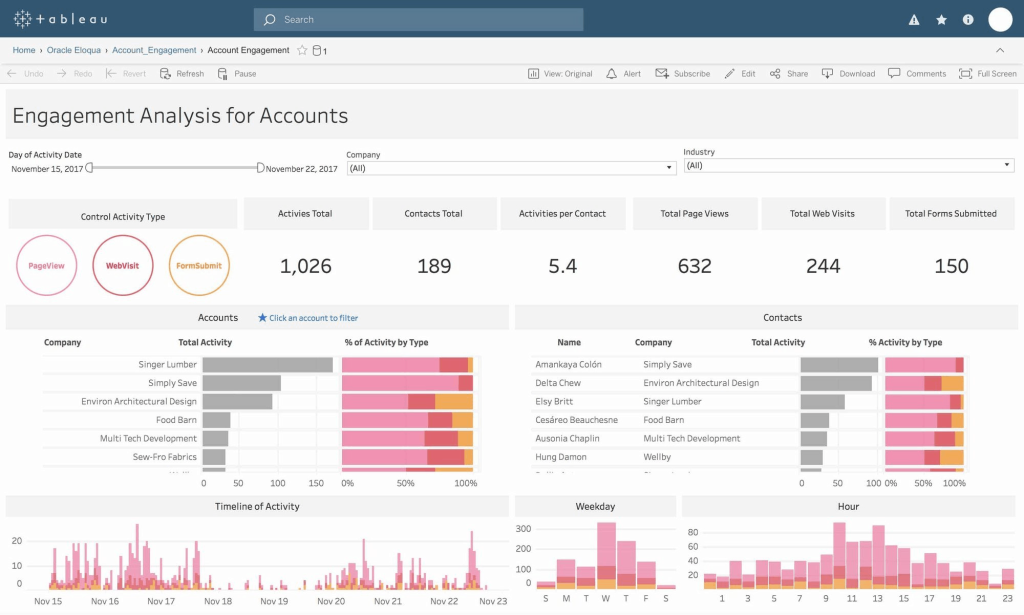
Image: Sample Tableau Desktop Dashboard
Some third-party vendors have started online marketplaces for Tableau templates to help fill in the service gap here, but Tableau owners (at least for now) will mostly have to build reports from scratch without templates as guidance.
Score:
LookerStudio: 18/20
Tableau Desktop: 15/20
Pre-configured templates for marketing reports are a massive time-saver and a benefit for new users just learning how to use Google data studio.
Looker Studio vs. Tableau Desktop: Unique Features & Selling Points
Looker Studio Unique Features: Streamlined Report Sharing
While Tableau Desktop was designed to be used offline, Looker Studio is an entirely web-based application. While Tableau users may have to download PDFs of their report and share them with colleagues by email, Looker reports are already hosted online and it takes just seconds to invite new collaborators/viewers or generate a universal sharing link.
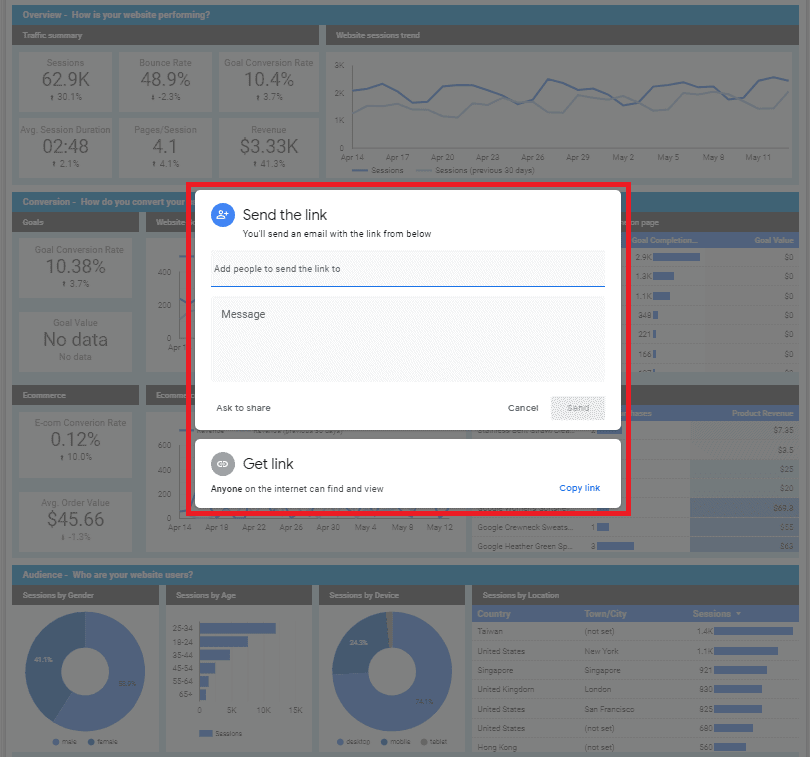
Image: Looker Studio Report Sharing
Tableau Desktop Unique Feature: Data Stories
Data storytelling is a Tableau reporting format that helps users construct a more cohesive narrative using data. Users can build customized story tabs (indicated in the image provide) with supporting data to convey meaningful insights and support data-driven decision-making.
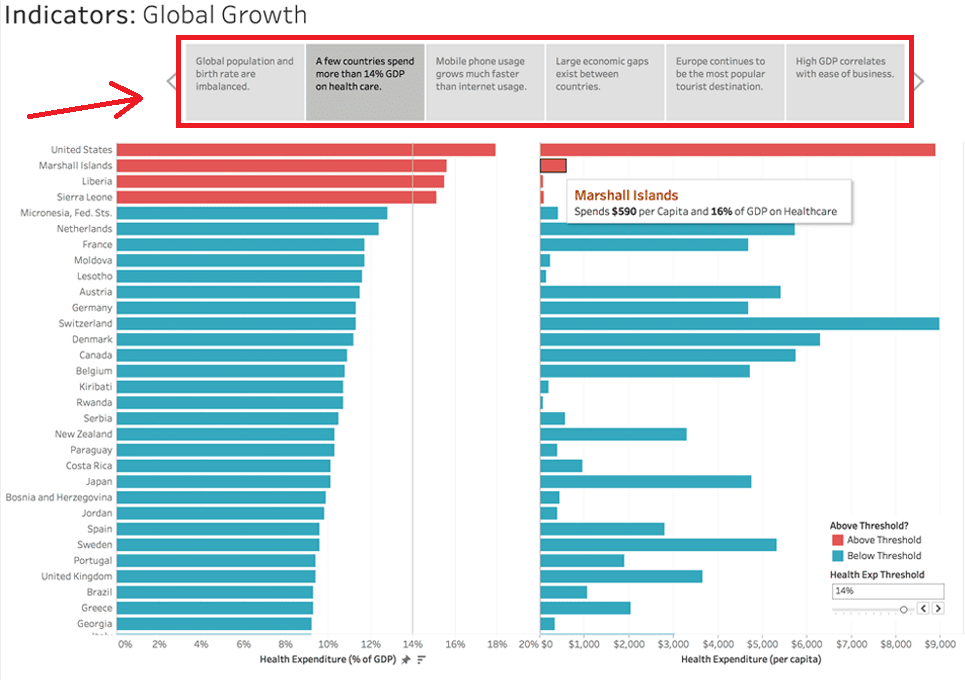
Image: Tableau Desktop Data Storytelling Feature
Score:
Looker Studio: 16/20
Tableau Desktop: 17/20
Which of these unique features leaves users better off? It ultimately depends on the situation. While marketing teams might value the ability to quickly share reports and insights, data stories can convey powerful, data-driven messages with more potential for business impact. For that reason, we have to give Tableau Desktop a slight edge.
Looker Studio vs. Tableau Desktop: Pricing & Access
Looker Studio Pricing & Access: Looker Studio is a free tool that’s available for online access by anyone with a Google account – you don’t even need your own web domain to get started.
Tableau Desktop Pricing & Access: Tableau offers a range of subscription packages, with options for individuals, teams, and enterprise organizations. Individual subscriptions start at $70/month, but there is a 90-day trial available to help users get accustomed to the platform. Team licenses for Tableau desktop are a little more complicated: they must include at least one creator license ($70/month each), five explorer licenses ($35/month each), and 100 viewer licenses ($12/month each) for a total cost of $1445 monthly.
Small teams can save money on Tableau by choosing individual subscriptions, but this requires separate deployments of the tool and blocks collaboration and data sharing.
Score:
Looker Studio: 20/20
Tableau Desktop: 14/20
Tableau might make sense as a data management and reporting platform for enterprise organizations, but most smaller marketing teams will find the platform too costly and without enough marketing-specific feature optimizations to justify the cost. On the other hand, Looker is free to get started and there are loads of templates available, so marketers can start getting value from the platform right away.
Looker Studio vs. Tableau Desktop: Final Score
We tallied up the final scores from our comparison and here’s what happened… Looker wins!
Looker offers better integration with ad platforms like Criteo and AdRoll, as well as social advertising platforms like Facebook, LinkedIn and Instagram. This is probably better for marketers than the database integrations offered by Tableau Desktop.
While Tableau did offer better data analysis capabilities, we liked how easy it was to find templates for Looker that would help digital marketers start developing insights within minutes of registering on the platform. Both platforms offer unique features that are valuable for digital marketers, but when it comes to accessing those features, Looker Studios wins by a landslide – because there’s no better price than free.
The final score was…
Looker Studio: 87
Tableau Desktop: 80
Summary
When it comes to Looker Studio vs Tableau Desktop, Looker is probably the best option for most digital marketers. The platform is completely free to use, easily connects with a variety of marketing channel data sources, and it’s easy to start producing data visualizations with the available templates.
Tableau Desktop has a lot of its own merits as well, but it’s more appropriate for larger enterprise organizations with dedicated reporting teams who can take the time to organize databases, customize their own reporting templates and conduct in-depth analysis with Tableau’s superior analytics tools.
Thanks for reading our comparison of Looker Studio vs Tableau Desktop! We hope our guide sheds light on what these business intelligence tools have to offer and helps you choose the one that’s best for your business.
-
CEO Garrett Mehrguth
Did you enjoy this article?
Share it with someone!

