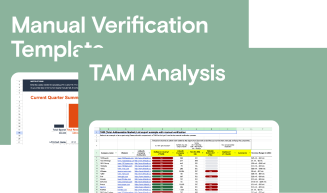
1st-Party Data Unlocks Customer Growth
By mapping your Total Addressable Market (TAM), building account lists, and manually verifying each company on your list, we’re able to aggressively scale your spend for impressions that matter.
- TAM Analysis Training
- Manual Verification Template
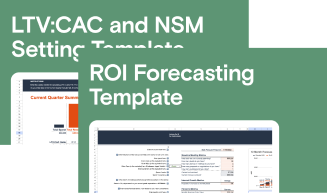
Financial Modeling is a Need to Have
Scaling without financial modeling is a pipe dream. We partner with you to identify your most impactful levers for growth, while giving you the tools you need to improve your capital allocation.
- LTV:CAC & NSM Setting Template
- ROI Forecasting Tool

NSMs Focus Capital & Drive Growth
The best in tech galvanize around one North Star Metric (NSM) to focus their decision making around go-to-market strategy as well as capital allocation.
- LTV:CAC & NSM Setting Template
- ROI Forecasting Tool
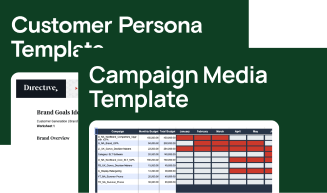
Brand Creates Demand
Only 5% of buyers in the average B2B category are in-market and ready to buy at any given time. Brand campaigns ensure that the other 95% know who you are. When they enter the buying journey, your product is their first stop.
- Customer Persona Template
- Campaign Media Template
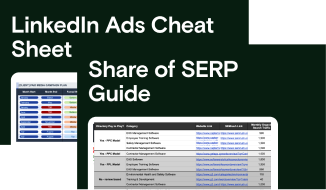
Integrated Performance Marketing Converts Demand
When your customers are ready to research, compare, and purchase (as a result of brand initiatives), integrated performance marketing ensures their experience is omni-channel, consistent, and personalized. This is how we convert demand into Customer Generation.
- LinkedIn Ads Cheat Sheet
- Share of SERP Guide