


“I know that only half of my advertising works, but the only trouble is that I don’t know which half.” –Henry Ford
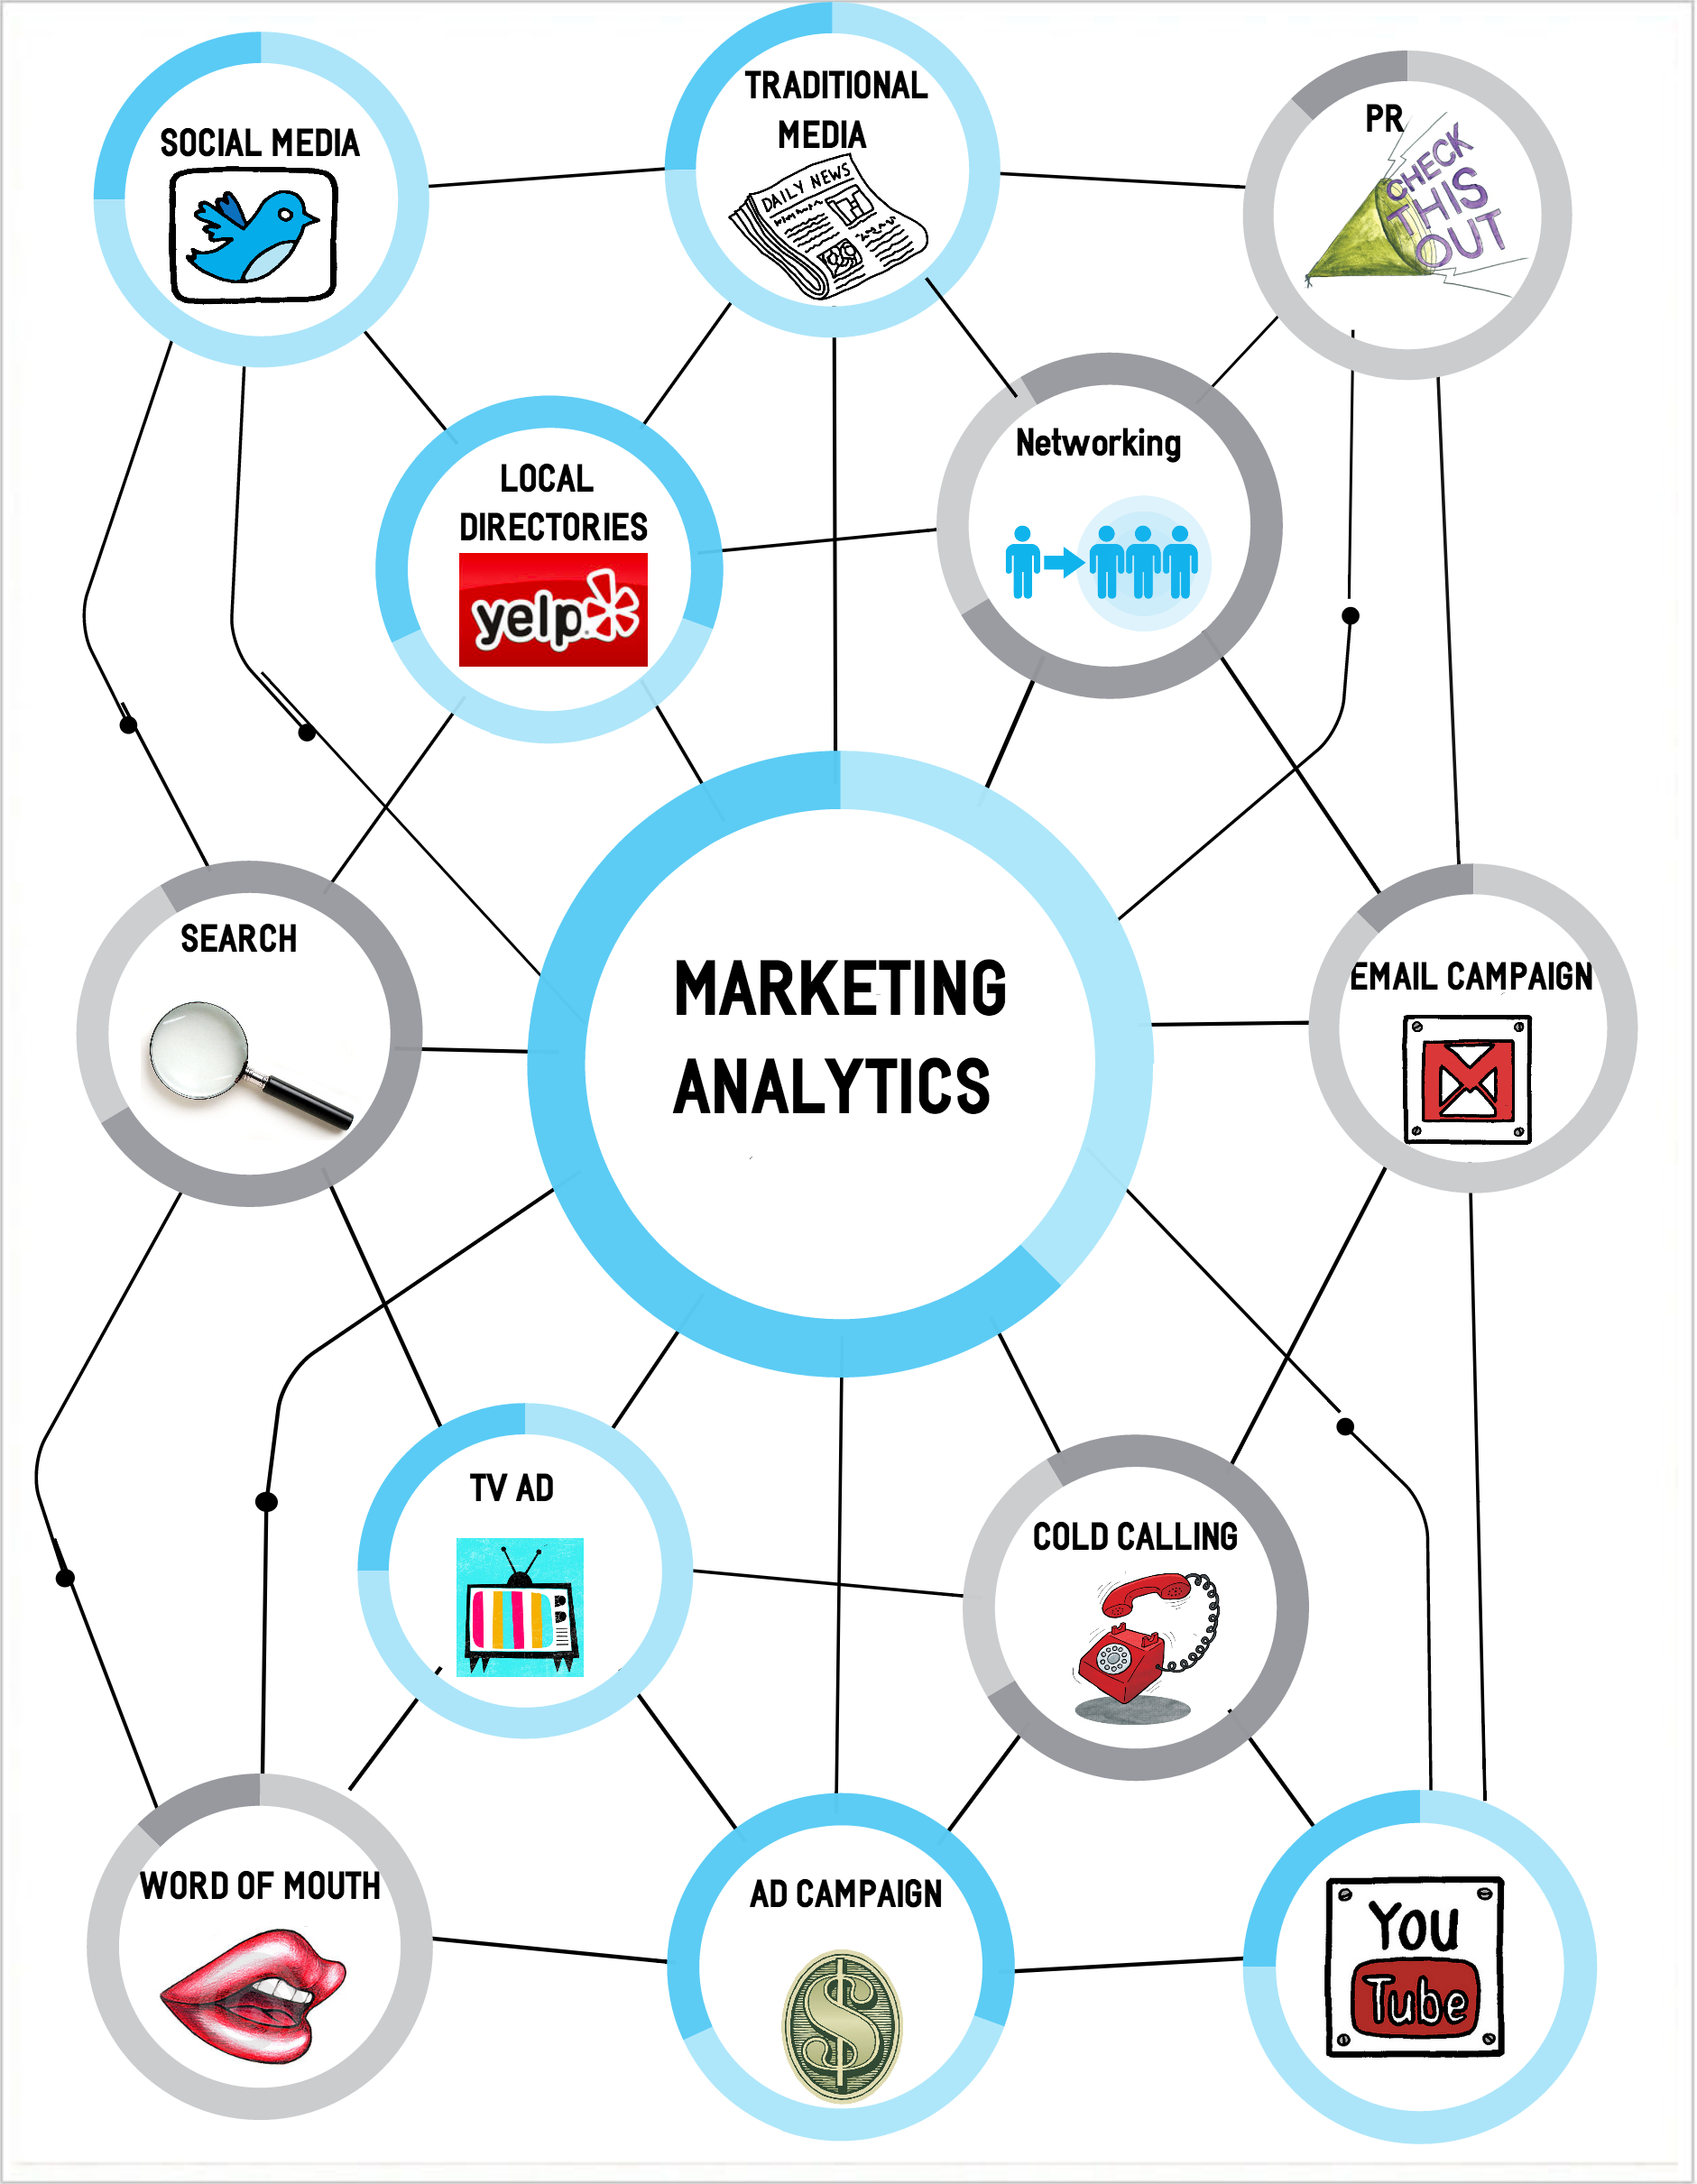
If you own a business, big or small, then you spend a certain amount of money on marketing each year. In today’s world with online advertisement, local directories, emails, and social media; there are many different marketing channels you can use to promote your business. More marketing channels is great. It creates different ways to reach your target market, and it makes you more money. However it creates one big problem. What marketing channels are working and which ones are not? What if you could track each marketing channel and put your money into the ones that are bringing you more sales. That is where marketing analytics comes in.
The Benefit of Marketing Analytics
Marketing analytics is the process of giving credit to all marketing channels that lead a client to finding a business and making a purchase. In 2012, Google did a study where they looked at the purchasing journey of 3,000 shoppers across numerous verticals. All 3,000 of them took different paths to making that purchase. A customer travels through multiple media channels until they make their final purchase. The benefit of knowing the client’s journey is that it tells you what marketing channels are making you the most money. Once you have this insight you can optimize that channel and allocate more resources (money) to it.
The Struggle
Without the proper tools and insight, Marketing Analytics is not easy. There are a plethora of online and offline marketing channels. Companies like Google, Yelp, and Facebook are now providing analytics, but they offer an overwhelming amount of data for someone who is not a marketing analytics expert. This guide will help you analyze your data quickly and effectively so that you will be able to track the return on investment on both your online and offline marketing channels in one place.
Online Tips for Marketing Analytics
If you are a large business that spends a high amount of money on advertising then you may have a budget for a marketing attribution company such as Market Share or Adometry. However, if you are a smaller company that does not have thousands of dollars to spend on marketing attribution, this guide will show you useful resources that are free.
Google Analytics
Before we begin to analyze the data, there are a few things that should be covered. So first thing is first. If you haven’t already signed up for Google analytics, sign up for an account. Make sure to add your website, and then access your account. Now it may seem like you have just entered the matrix. There are a bunch of weird words that have no particular meaning to you and complicated graphs that seem to display something important. Do not worry we are going to go through the basics first.
Impressions vs Clicks
Clicks are how many times someone has actually clicked on your website. Impressions represent how many times your website has been visibly displayed in front of a searcher. You will always receive more impressions then clicks.
Sources vs. Channels vs. Mediums
Sources represent the point of origin from which the searcher began. There are three types of sources.
- Search: The user began with a search engine such as Google/ Bing/ Yahoo.
- Referral: These are links from other websites that have directed searchers to yours.
- Direct: This just means that the searcher typed your website name directly into the URL.
Channels represent the path in which the user takes to get to the website. There are many different channels, but here are a few examples.
- Social Network
- Organic Search: The traffic came from the search engine and not from a paid advertisement.
- Paid Search
- Referral
Mediums represent the way the website link was delivered to the visitor. There are three types of mediums.
- Organic Search
- CPC: Paid Advertisement
- Referral
Knowing these terms will help you to better navigate through analytics, and understand what to look for according to your particular business.
Establish Primary Goals
Establishing your goal/s is very important because it weighs the value of the results according to that goal. Every company has an end goal that they are trying to accomplish with their website. The first step to structuring a return on investment from analytics is creating a goal and goal value.
Steps:
- Begin by: Clicking on the “Admin” tab that is located at the very top of the Analytics page. Next click on “Goals” which is located all the way to the right under “All Web Site Data.” Finally click on “+ New Goal” which is highlighted in red.
- Goal Setup: The next step depends on the website’s business model. The first section “Revenue” is for an e-commerce business model. The third section “Inquiry” is recommended for the typical businesses that provides their services and products offline. “Contact Us” is a good primary goal to set because the purpose of a website is to ultimately have the user call them.
- Description: The purpose of this step is to set the requirement for the goal. The requirement can be just as easy as reaching the page (destination), or there can be a time limit set for how long the user stays on the page before the goal is met (duration.)
- Details: First copy the URL of the page that you want to make your goal. For instance, if you chose “Contact Us” then copy the URL on your contact page. Next you must determine the value of the goal. This is different for every industry. When determining a goal value, keep in mind how valuable it is for your business to be contacted by a new customer.
Configure SEO Reporting into Marketing Analytics
If you have not enabled Webmaster Tools data with your website, your SEO (Search Engine Optimization) reporting will show up blank. Having SEO reporting is very essential before analyzing your data. SEO reporting displays what search queries are driving users to your website, and what pages are being visited the most. If you have not done it yet, do not worry, enabling Webmaster Tools with your website is as easy as making a Facebook post. All you have to do is go to Webmaster Tools, and add your website.
Now that you have learned the Vocabulary and finished all the backend work to setting up your Google Analytics, it is time to perform Marketing Analytics.
Acquisitions
First, take a look at the overview under the “Acquisition” tab on the left. This shows you a basic overview of all your acquisition information. Acquisition is an important tool to look at because it displays what channels are bringing more visitors to the website, interacting with what pages, and eventually converting into sales.
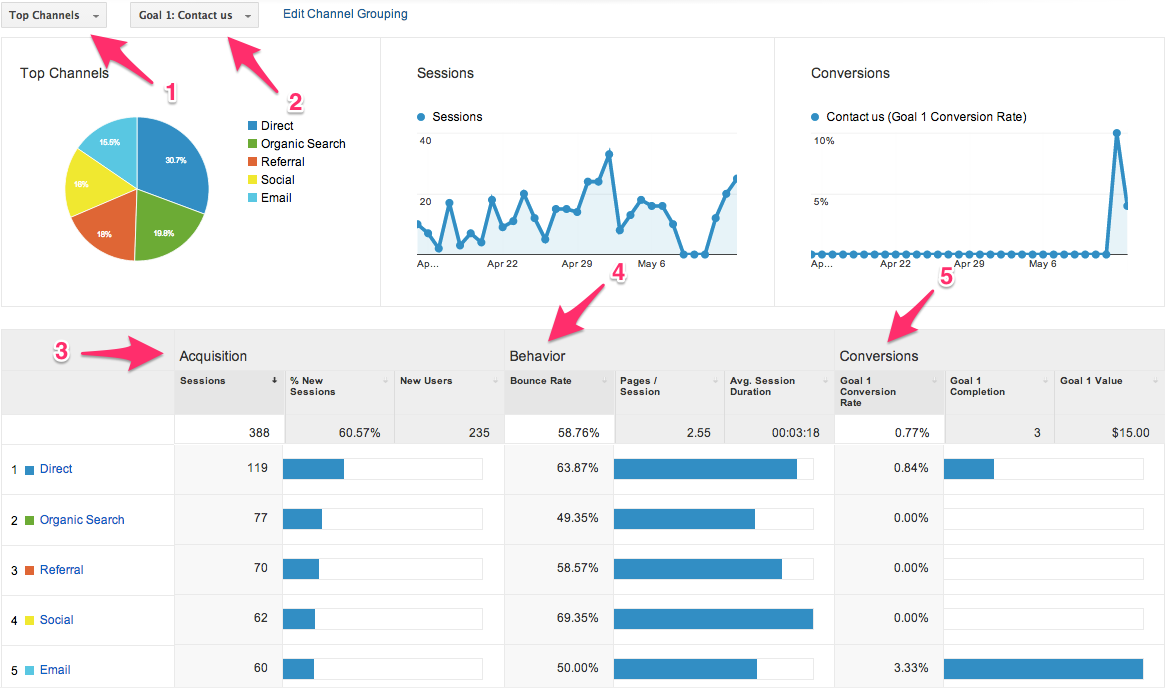
- Channels: Now that you know the difference between channels/mediums/and sources, you can choose which one you want to display in your reports. “Top Channels” is the most common for marketing analytics because it displays which channels are bringing in traffic.
- Goals: Now that you have set your goals, you can choose which goal you want to analyze. In this example, I choose to use the “Contact Us” goal because in most cases the end goal for business owners is to get calls from their website.
- Acquisition: This basically shows you which channel led the most people to click on your website. As you can see in this example, the “Direct” channel is bringing the largest amount of traffic to this particular website.
- Behavior: This indicates which channels are bringing traffic that interacts with the website. As you can see there are tabs at the top that display session times for how long the user was on the website. In this case the “Social” channel is bringing the largest amount of traffic that interacts with the website.
- Conversions: This indicates which channels are bringing traffic that leads to a conversion (Contact Us.) Once again, the conversion is the goal that you have chosen. In this case, the “Email” channel is bringing in the most traffic that is being directed to the contact page.
According to the example above, marketing analytics would indicate to keep performing the email campaigns because it is bringing in the most users that call the company.
SEO
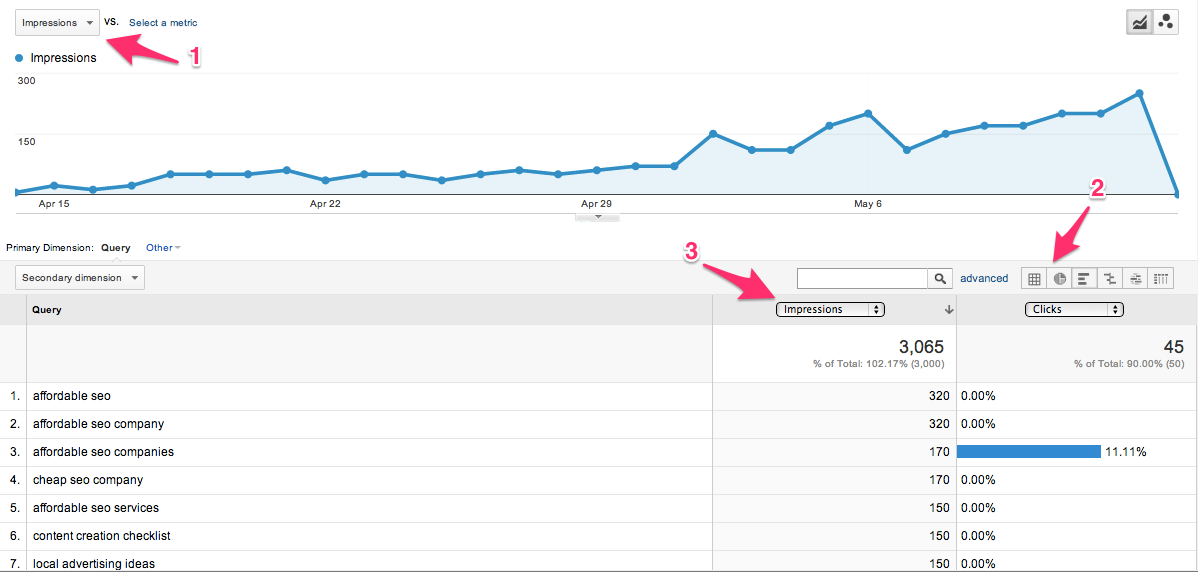
There is one more great tool underneath the “Acquisition” tab. Click on “Search Engine Optimization” and go to “Queries.” This page displays what keywords are driving traffic to your website.
- Impressions: Now that you know the difference between impressions and clicks you can choose which one you want to be displayed in the report.
- Advanced Chart: This feature is extremely helpful when trying to compare impressions to clicks. If you click on the third tab from the left in the advanced tool bar it will display the chart above.
- Impressions vs. Clicks: Comparing impressions to clicks is very helpful because it indicates which keyword is actually leading users to click on the website. If a keyword is receiving a high amount of impressions but low amount of clicks, then you might consider refining your keyword strategy because your current keyword is not bringing the right traffic to your website.
Now that marketing analytics has shown you what keywords are bringing in more clicks, you can use more resources to optimize for those keywords.
Behavior

Next, go down to “Behavior” on the left tab and click on “Behavior Flow.” Behavior shows you how the user interacted with your website. It shows which pages they bounced from and which ones they stayed on the longest. “Behavior flow” shows all of this and the path in which the user took throughout the website.
- This tool categorizes the behavior of each type of user. For Marketing Analytics, use “Default Channel Groups” because it determines the behavior of users by the media channel they used. Also, there is another interesting tool that is found in the drop down tab. Go to “Users” and click on “City.” This is an interesting tool that tells you what cities are going to what pages on your website.
- The red bars represent the drop-off rate for each page.
This type of marketing analytics shows you which pages need to be altered and which ones need to be optimized. With the example above, one can see that the majority of traffic is going straight from the main page to the blog. The majority of users are going to the blog and then to particular blog articles. This would suggest that the articles are bringing in the most traffic for the website because they are receiving the most activity.
Conversions

Next, go to “Goals” under the “Conversion” tab, and click on “Overview.” This is a basic overview that displays how many times your goal has been completed, and what pages and channels are leading to that goal. You can choose the time period in the top right hand corner.
- Goal Conversion rate is the rate of users that visit the website and complete a goal during their visit. In this case, it is the percentage of users that come to the website that go to either the contact page or the view more page (services.)
- This gives you a choice between viewing the pages that lead to goal completions or the sources/mediums that lead to goal completions.
- In the example above, “personal contacts/emails” are bringing in the most goal conversions.
The benefit of using both the “Goal Completion Location” and the “Source/Medium” is that you can see what channel is bring in the conversions and what pages are these conversions going to before they go to the contact page. This lets me know what channels to invest more money in and what pages to that I need improve.
Attribution Models
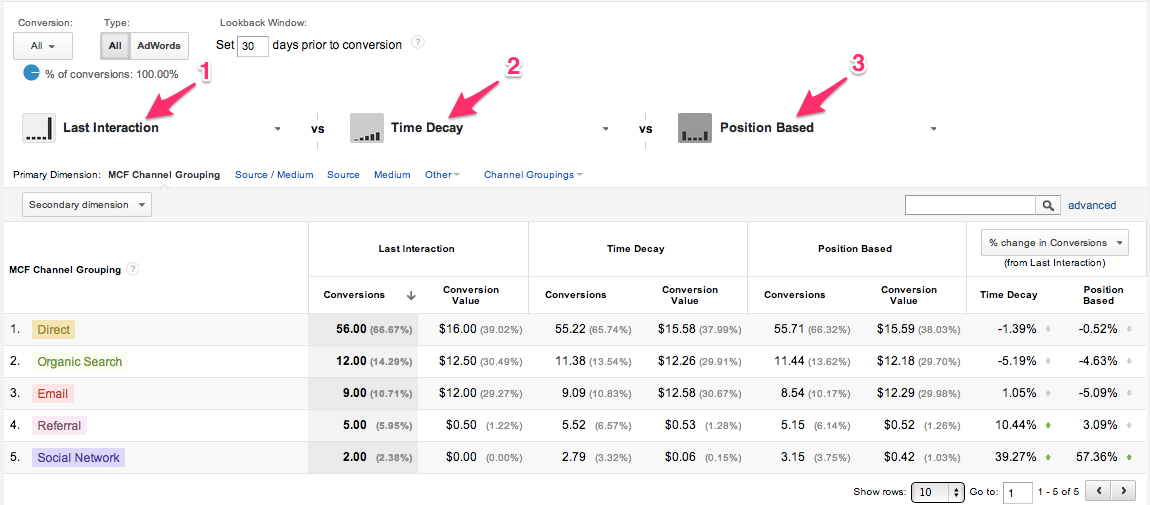
Next, go to “Attribution Models” under the “Conversion” tab. This tool is essential for companies that are very active online! Google Analytics automatically uses the “Last Click Model” for their results. This model is dying in marketing analytics because marketers realize that the user journey is much longer than the last click. If the user went through multiple media channels to make the final purchase then all media channels must be given credit. There are many different models for this because there is no easy solution for accurately distributing the appropriate credit to each channel along the user’s journey. However, there are two main models that are used for businesses.
- We are going to compare each model and see if there is a significant difference in the results. Begin by choosing Last Interaction as the first model because that is Google Analytics’ default model.
- Time Decay: This model is more effective for businesses that rely on lead generation. These consumers are less impetuous and they need you to their build trust. The more expensive the product or service the more true this becomes. That is why the Time Decay Model gives more credit to each click as it approaches the final conversion.
- Position Based: This model is more effective for E-commerce sites. Consumers who buy online are typically more sporadic. They like to shop around, gather information from other sites, and look at reviews. The Position Based Model gives the most credit to the first and last click with a little bit of credit for the clicks in between. The first click is important because it introduced your company and the last because it led to the conversion.
Shortcuts
I know I said that this would be a guide that helps you use marketing analytics quickly and effectively to analyze results. That is where shortcuts come in. All of the features that I just showed you can be put into your “Shortcut” tab. There is a “Shortcut” option on all of the featured pages at the very top left corner that gives you an option to put that page as a shortcut. This will put all of the features that you need into one spot.
Dashboards
Dashboards make it even easier to analyze reports in Google Analytics. Basically, you can put any feature that you like from each section onto one dashboard. This makes it easy to analyze everything all at once. This tool is very valuable, especially if you are managing an account for a business owner. Google Analytics has the option to automatically send your dashboard to your clients on a monthly basis.
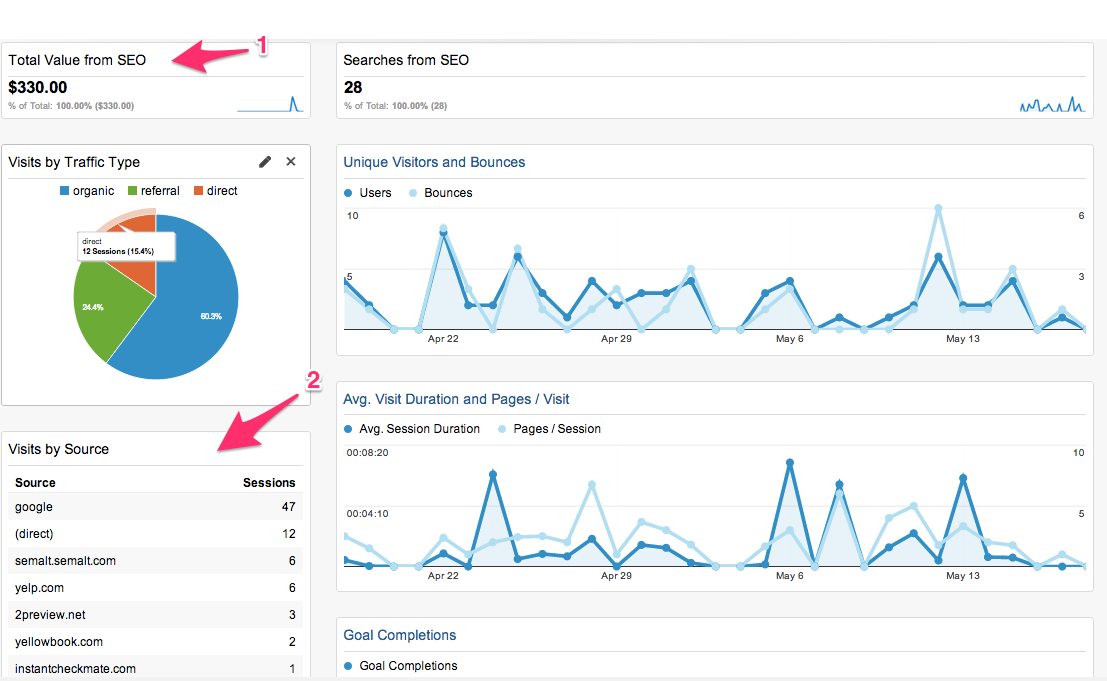
- This is a valuable marketing analytics tool because it demonstrates whether your Search Engine Optimization Costs are paying off.
- Another suggestion would be to add the “Visits by Source” feature because it shows what sources are driving traffic to the website that month.
If you do not feel ready to make your own dashboard, there are plenty of dashboards that you can import into Google Analytics. Here is a list of some very useful dashboards made by Google Analytics experts.
Offline Tips for Marketing Analytics
Any offline marketing analytics will have to be done the traditional way, and that is through direct contact with the consumer. However, there are a couple of tools that are useful for doing this efficiently.
-
Coupons
If you assign a coupon with one of your media channels, you can track its effectiveness. Every time a person asks for a discount you can be confident that they were reached by that media channel.
-
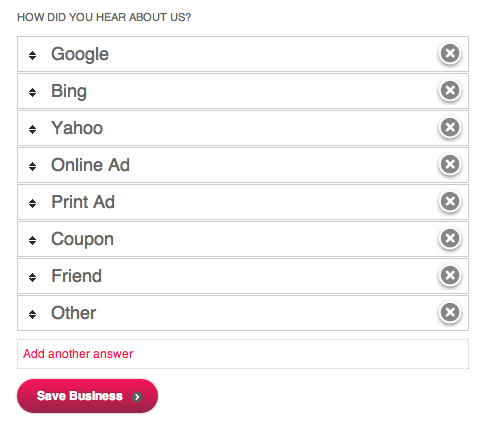
Invoice/ New Client Form
You can simply place, “how did you hear about us” on the invoice. This is an effective way to do marketing analytics for service-oriented businesses. Here is an example:
Combining Offline & Online Marketing Analytics into Google Analytics
Keeping track of offline and online marketing data may become overwhelming. If you want to keep everything all in one place here is an awesome tool to import your offline conversion data into Google Analytics. Make an account at whitespark.com. Add your business name and make a list of your offline channels like the ones listed below.
Once you receive results from your offline marketing channels make sure to plug them into this software and it will automatically be transferred into Google Analytics.
Marketing Analytics is Worth the Time
Marketing Analytics is a very valuable asset to add to your business model. If you are a small business owner you probably spend hundreds of dollars on Yelp, Email Campaigns, Social media management, SEO, and more. It is important for you to know if these media channels are actually making you money. Marketing Analytics does not only show you which media channels are wasting your money, but which ones are working so you can optimize them. Remember, if you ever get overwhelmed when it comes to tracking your analytics use this guide to help you get it done quickly and effectively.