


Improving Site Speed for SEO
Did you know that sites that load in five seconds (compared to those that load in 19) see 70% longer average sessions?
Did you know that the chance of a bounce increases 90% when the page load time goes from 1 second to 5 seconds?
It’s clear that to rank higher on Google, you must improve your page speed.
The Need for Speed
Page speed is the time it takes to load the content on a given web page.
We can understand the importance of page speed along two connected and related dimensions that both impact business results: user experience and search engine optimization
From a user experience standpoint, we know that user experience declines when a web page takes forever to load and become interactive. Check out this page load time infographic that was compiled from research that Google published in collaboration with SOASTA, Inc. in 2017.
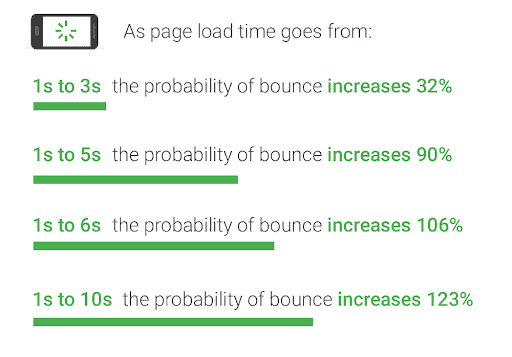
Image courtesy of Google/SOASTA Research, 2017.
A “bounce” happens when a user visits a specific web page, then leaves without interacting with the page. This study was based on an analysis of 11 million mobile ads’ landing pages, and the results are clear: the longer your web page takes to load, the more likely it is that users will “bounce” from your page without interacting.
Users have come to expect fast and seamless experiences online, and they grow impatient quickly when pages take too long to load. As a result, they’re more likely to leave without interacting, which negatively impacts the conversion rate and brand experience.
On the SEO side, we know that Google has used page speed as part of its search ranking algorithm since 2010.
A group of researchers analyzed median load times for over a million domains using the Alexa database, and here’s what they discovered about the impact of page speed on search engine results page (SERPs) rankings:
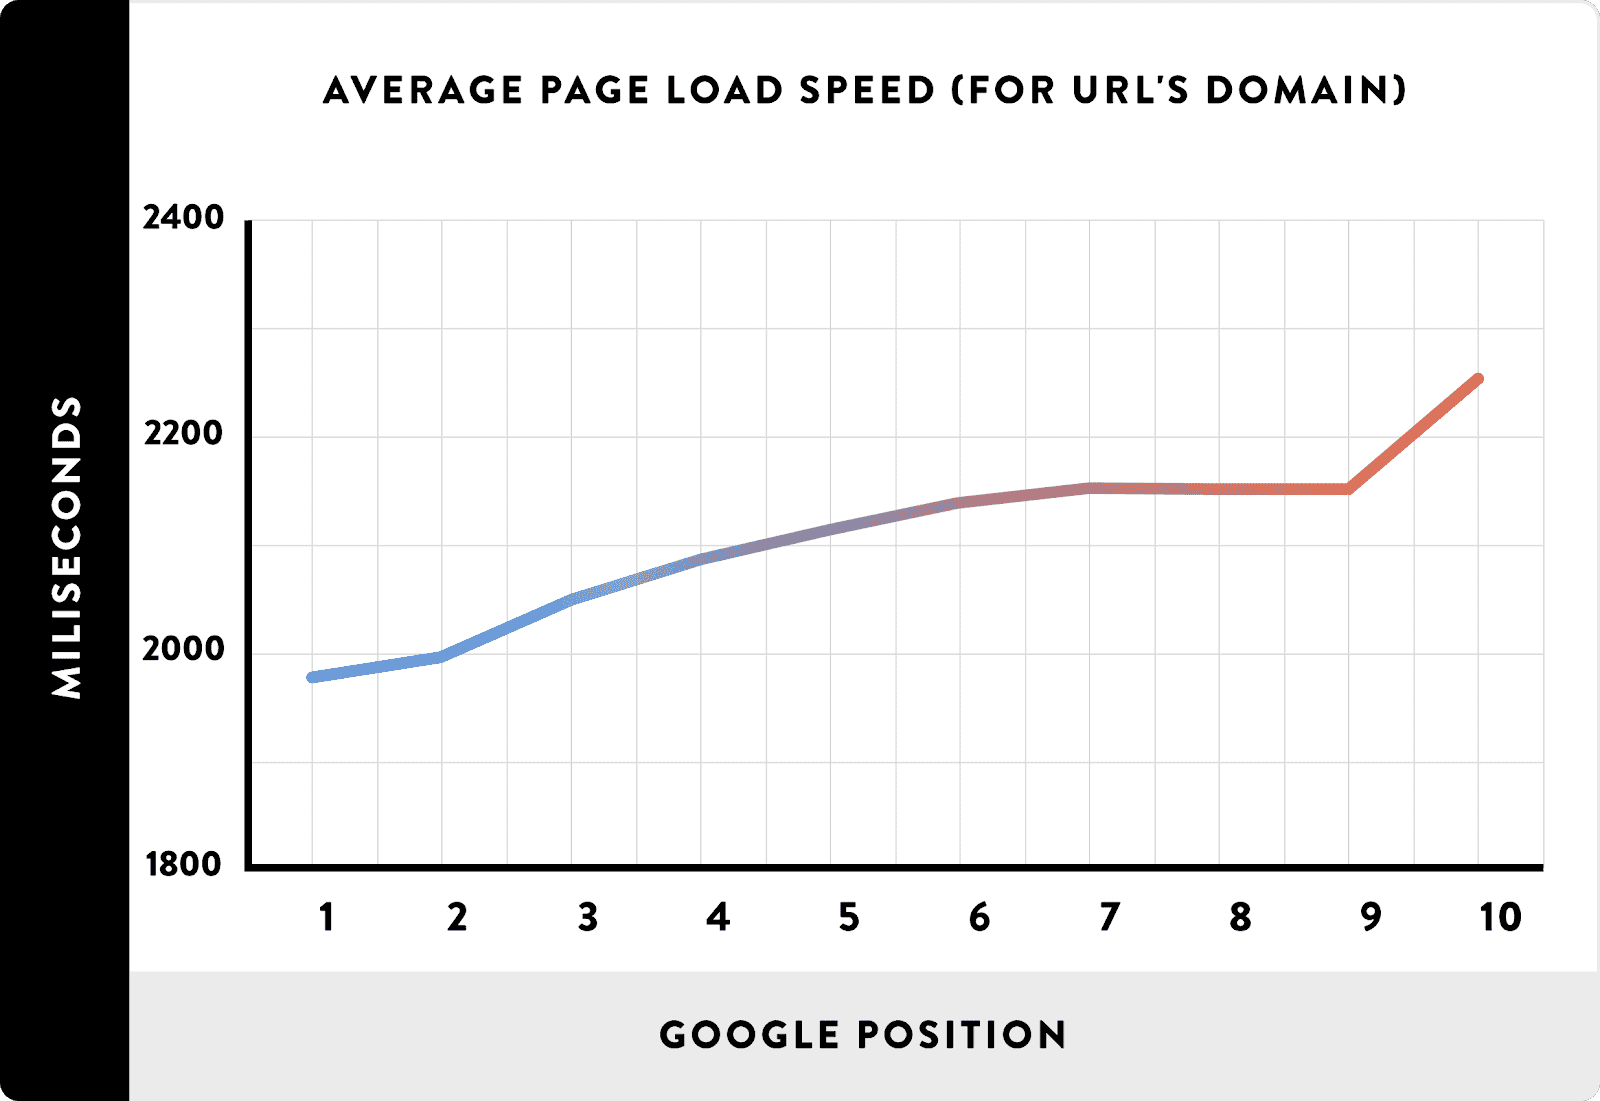
Image courtesy of Backlinko.
With over a million data points analyzed here, the lesson is clear: websites with faster page load times are more likely to rank higher in the search engine results. That means your brand is more discoverable and more likely to grow overall.
Based on this information, we develop a clear picture of how page speed impacts SEO. Faster pages, all things equal, are more likely to rank higher in the SERPs.
Page speed optimization can help improve business results and is worth the effort and attention of your team.
PageSpeed Insights Breakdown
PageSpeed Insights is a free tool/service provided by Google. The tool provides a performance report on page speed for a given URL and offers suggestions on how the page could be optimized to decrease the page loading time.
Webmasters should be aware that PageSpeed Insights displays field data, which it collects through Real User Monitoring (RUM). Whenever an internet user anywhere accesses a website using the Google Chrome browser, Google captures data on the loading performance of the web page.
As a result, PageSpeed Insights data does an excellent job of capturing the real-world user experience that a web page offers to users with a variety of devices and network settings.
Generating your first PageSpeed Insights report takes just a few seconds. First, you’ll need to access PageSpeed Insights on the Google Developers website.
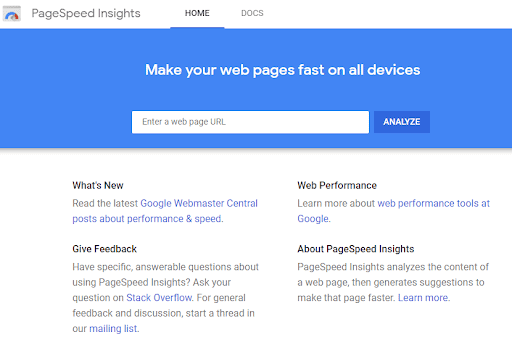
You should notice that there are two tabs at the top of the screen. You’ll start off on the home tab, but there’s also a separate tab called “DOCS” where you can find additional information about the tool, including release notes and instructions for using the PageSpeed API.
From the Home tab, you’ll see a field with the instructions “Enter a web page URL” and a button that says “Analyze”.
There are some additional links and resources below, but you can explore those on your own at a different time.
Enter the URL of the web page that you want to assess and click the green Analyze button to start using PageSpeed Insights.
PageSpeed Insights – Get to Know the Report
Once you click “Analyze”, you will see a blue loading bar and slowly fill to 100% while PageSpeed Insights gets your report ready.
When your report finishes loading, you should notice that information is grouped under five subheadings: field data, lab data, opportunities, diagnostics, and passed audits.
As we go through the report, you will encounter specific data about page speed and performance along with recommendations for how page speed can be upgraded.
Google also performs audits of web page characteristics that affect page speed. You will be able to review any negative results of those audits in the diagnostics section of the report and any positive results in the “passed audits” section.
Field Data
The first information you will receive in a PageSpeed Insights report is the field data for the web page URL you entered over the past 30 days. Field data is particularly important because it is collected from authentic user interactions with the web page.
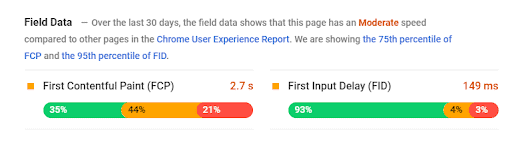
Here’s how to read the example above:
PageSpeed Insights shows field data from the past 30 days for First Contentful Paint (FCP) and First Input Delay (FID).
FCP measures how long it takes between when the page-load is initialized and when the first piece of content is rendered on the page. In this example, the bar is divided into 35% green (fast), 44% orange (moderate) and 21% red (slow). PageSpeed Insights is telling us that:
- 35% of users experienced a fast loading time for this page of < 1 s
- 44% of users experienced a moderate loading time for this page of 1-3 s
- 21% of users experienced a poor loading time for this page of > 3 s
FID measures what happens when users interact with the web page. A longer delay means that the web page takes a long time to respond to user input, usually because the main thread is busy loading something else on the page. In this example, PageSpeed Insights is telling us that:
- 93% of loads for this page had a low FID of < 100 ms
- 4% of loads for this page had a moderate FID of 100-300 ms
- 3% of loads for this page had a high FID of > 300 ms
Lab Data
Unlike field data that is generated from user-collected data, Lab Data is generated by Google Lighthouse. Lighthouse simulates page loading on a mid-tier device using a mobile network to generate page speed measurements that are standardized for device type and network configuration.
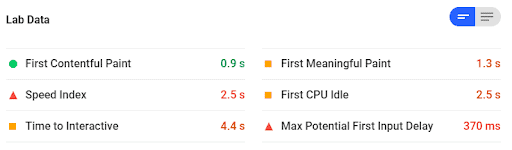
- First Contentful Paint (FCP) – a measure of the time between when the user first accessed the page when the first piece of content was rendered on the page.
- First Meaningful Paint – a measure of the time between when the user first accessed the page and when the primary above-the-fold content became visible to the user.
- Speed Index – an indexed measure of how quickly content on the page is displayed during the time that the page is loading. The speed index is calculated by capturing a video of a page loading in the browser and computing the visual changes between each frame of the video.
- First CPU Idle – a measure of the length of time between page initiation and when the page becomes minimally interactive or able to receive user input.
- Time to Interactive – a measure of the length of time between page initiation and when the page becomes fully interactive.
- Max Potential First Input Delay (FID) – a measure of the maximum time between when a user interacts with the web page and when the browser responds to the interaction.
With these six measurements, webmasters gain end-to-end visibility of the loading process for an individual web page.
You will also notice that some of the measurements in the above example are color-coded: green for fast, orange for moderate, and red for slow. This makes you find problem areas more quickly.
In this case, a fast FCP measurement for the page indicates that it starts loading quickly; however, there could be opportunities to make this web page more responsive by introducing page speed optimizations that would decrease the First CPU Idle and Time to Interactive measures.
What do these numbers even mean?
To make things crystal clear, there is no absolute goal that you need to reach that will make you have perfect site speed. These numbers that PageSpeed Insights is providing are simply benchmarks for where they believe you should be to be considered good or great.
Any time that is colored green is considered great, and no changes need to be made. Even if the color is orange, you are most likely in a good spot and may want to tweak a few things on your website to improve load times.
Once you start bleeding into the red, that is when you should take action.
But how much do you need to improve? Any changes and improvements in load time will be helpful.
So the big thing is to try not to focus on the numbers themselves but focus on the opportunities to improve and execute them.
Opportunities
The third section of the PageSpeed Insights report lists the best available opportunities to make performance improvements to the target webpage.
The best feature of the opportunities report is that you’ll be able to see an estimate of how much each issue is impacting your overall page speed. This makes it easier to identify the best opportunities for improvement.
PageSpeed Insights usually highlights the three top opportunities for optimization that it identifies from the analysis. Some of the most common recommendations are:
- Eliminate Render-Blocking Resources – render-blocking resources include scripts, stylesheets, and HTML imports that the target web page is scripted to fetch and execute before it finishes loading the full page. Render-blocking resources should be deferred or marked with an async tag while critical JS/CSS scripts should be delivered inline.
- Reduce Server Response Time – Slow server response times directly lead to longer page load times.
- Remove Unused CSS – Any stylesheets with dead rules or unused plug-ins that load on the page can negatively impact page speed.
- Enable Text Compression – If a web page loads a text-based script or CSS with large file size, it should be served with compression to minimize network load.
- Enable Image Compression – If a web page loads large image files, it will load slowly. Compress images to minimize their size without sacrificing quality to an unacceptable level.
For each opportunity that PageSpeed identifies on a web page, it provides listings of specific scripts, stylesheets, files, or images that should be optimized. Click on the downward-facing arrow on the right side of the screen to get specific recommendations for each opportunity identified in your report.
Diagnostics
PageSpeed Insights performs a whole battery of diagnostics tests and audits to assess various aspects of page performance. In the Diagnostics section, you’ll find more specific details about your page speed loading times and performance. You’ll also receive actionable information to start building your optimization activities.
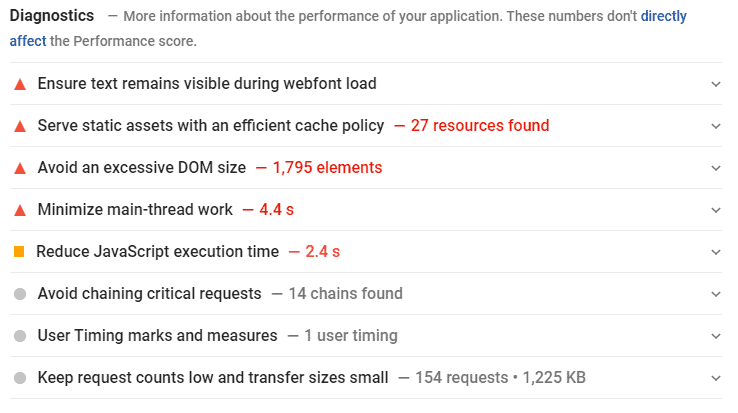
The example report above offers critical insights into why the web page is loading slowly.
According to this diagnostic, there are 1795 elements loading on the page, and the server is spending too much time parsing, compiling, and executing JS (scripts).
To optimize the page, a web developer should review the elements and scripts that load on the page, remove unnecessary items, inline any essential scripts or CSS, and defer the retrieval of any files that are non-essential.
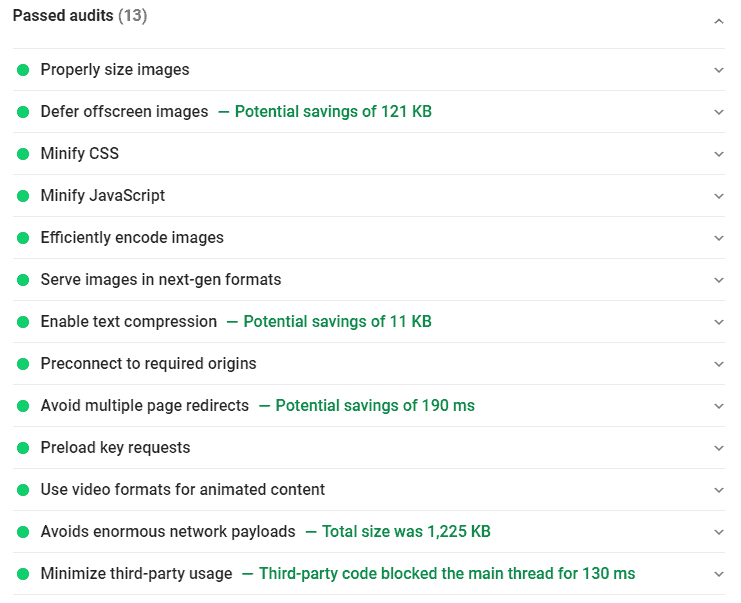
Passed Audits
The report section on Passed Audits lists all the areas of the analysis where the web page performed well. You want as many items as possible to show up in here! This means that you are properly optimizing your website to perform from a site speed standpoint.
How to communicate the need to improve page speed
While there is always a temptation to add more features to a website or landing page, think it through and understand if it will lead to unacceptable page loading times.
Many digital marketers have encountered situations where there is a need to communicate with developers or business managers about the importance of optimizing for page speed. This can lead to disagreement, especially if there is a perceived need to remove a valued feature or script from the page.
As a final word, here’s how I would approach communicating with team members about the importance of page speed optimization.
Communicating with Developers
The way to communicate with developers about page speed optimization is to focus their attention on the end goal. If that new feature they want to implement will negatively impact user engagement because of its impact on load time, it’s not worth it.
You could challenge the developer to implement the feature in a way that doesn’t impact page speed as much or ask him/her to find other optimizations that compensate for the impact of their desired feature.
If the disagreement is about removing a feature, you might propose conducting an A/B split test to assess the performance of the page under different conditions. Show some users a version of the site with the developer’s feature implemented and slightly slower load times, and other users a version without the developer’s feature and with faster load times.
You can measure interaction and conversions to see which one performs best, based on data.
Communicating with Leadership
Odds are, your leaders are business-minded, so they’re typically prepared to make concessions if it increases their bottom line. The essential note here is communicating how page speed optimization impacts business results.
Help them clearly understand why business growth shouldn’t be sacrificed for additional features.
Off to the Races
Site speed tends to be a sensitive subject amongst web strategy teams and web developers.
Web strategists want to make sure they are set for success by minimizing any potential negatives in the eyes of Google.
Web developers tend to be firm in the ways they format the website.
Both sides are right. Web strategists can not do much without the help of developers. However, what I hope is that you come out of this with a better understanding of the tools that are out there that can help both developers and strategists work together toward a common goal.
With Pagespeed Insights, you should have the power to introduce optimizations that decrease your page loading times, boost search rankings, enhance your user experience, and drive more revenue through your website.