


Key Points:
- We outlined 8+ different SaaS marketing metrics you must track.
- Learn how each of these SaaS metrics can help you make better decisions that lead toward growth.
- Understand where each of these SaaS metrics fit into various and real financial situations.
- See the SaaS marketing template our team utilizes: the LTV:CAC method.
- Review how our team incorporates these metrics into our real strategic decision-making process.
The only way to measure growth from SaaS search marketing (and all other marketing) campaigns is revenue.
However, that doesn’t mean revenue is the only metric your team should be focused on.
There are numerous metrics that are indicators of success and are vital to have access to and reference during your campaigns.
SaaS marketing metrics that matter
Conversion-based success metrics
For most SaaS companies, a conversion-based success metric could be a request demo form or a free trial sign up.
It doesn’t have to be a customer buying your product or service right away.
You must track these metrics because they give you a sense of the quality of inbound leads you’re receiving. Depending on the information gathered, the various conversions can be weighted differently.
For example, if your “free trial” sign-up form only requires an email to convert, then the ability to determine the qualification of that lead may be more challenging to do.
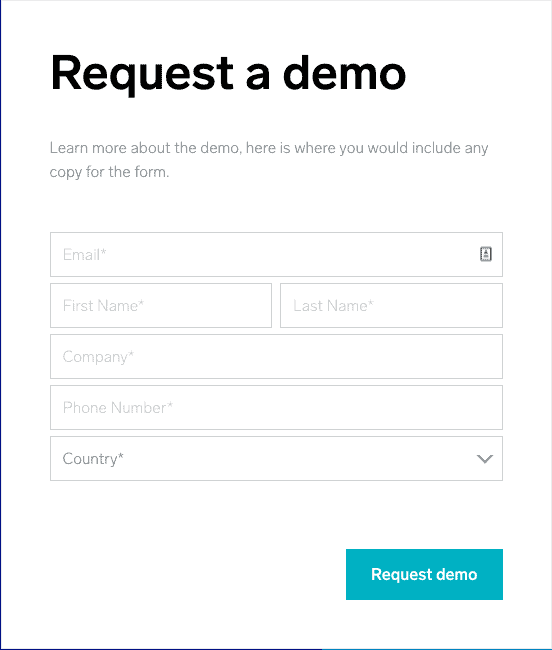
However, if the “request a demo” form requires more information, and it auto-qualifies each lead, then you can more easily determine if this lead would be a match for your company.
Depending on your total leads that come in from the different conversions, you may want to prioritize pushing users to specific conversion paths.
For this example, we are going to use the term auto-MQL, which means that the moment someone fills out the form, the lead turns into an MQL. This usually requires specific fields to be filled.
The “request a demo” form completion auto-MQLs at a rate of 80%, and you generate 1000 leads a month. The “free trial” sign-up form completion does not auto MQL, but you generate MQLs 50% of the time, and you typically generate 2000 leads per month.
Which path do you push to your audience more?
The weight of the “request a demo” form may be higher, but you generate more MQLs from the free trial sign-up in this situation. This depth of knowledge can help you and your marketing team, make decisions on which form you should be prioritizing in your navigation, in your ad campaigns, and more.
Sales-based success metrics
The SaaS industry is forecasted to experience a 17.8% increase in revenue growth and reach $278 billion by 2021.
For most SaaS businesses, revenue is that sales-based success metric; however, you can also include other metrics, including the total number of sales, average order value, customer lifetime value, and more.
Overall, a continuous flow of revenue is crucial for your business to grow. To fund new ideas, marketing initiatives, products, and services, you must have the capital.
For businesses that don’t want to debt or equity finance their companies, continue to fuel growth through sales, and reinvest those profits into proven marketing and sales channels.
Do your research!
Free trial conversion rate
The free trial conversion rate is the percentage of free trial users that became paying customers. The metric, especially for SaaS businesses, is a critical factor when forecasting future growth.
For example, you are a log management software company, and you typically get 2,000 new users using a free trial per month. After the 1-month trial, 500 of those users become customers. You can deduce that when you are forecasting future growth, regardless of the size of the growth of free trial sign-ups, you should expect 25% of those to become paying customers.
Track this metric to help you forecast future revenue.
Churn rate
For SaaS businesses, a target churn rate is typically around a 5-7% annual churn.
Churn rate is the percentage of customers that stop using your product or service, annualized.
Churn is focused on by almost every business in all industries because it can be applicable for products, services, employees, and more.
In reference to SaaS products, churn is another forecasting tool that helps you determine the loss of future revenues.
For example, if you typically churn 5% of your customers annually, then you know that you must grow at a rate of greater than 5% year-over-year.
Depending on the price of your product, the customer lifetime value (LTV), and operating costs, this concept becomes a little bit more complicated, but for the most part, the idea is the same.
You must generate more revenue than you churn.
How do you reduce churn?
You can learn a lot from product reviews. The best way to reduce churn is to listen to your customers and pivot your product and services based on what the main concerns of the customers are.
Average Order Value (AOV)
The average order value (AOV) is calculated by dividing the total revenue generated from sales by the total number of sales. AOV, in conjunction with gross margin (GM%) and customer lifespan (in years), is needed to determine the LTV.
All else equal, as you increase your AOV, you increase your LTV, which increases your long-term profitability. These numbers also help you determine the most effective pricing strategy.
There are many ways to increase your AOV, such as cross-selling, upselling, volume-based discounts, coupons, and more.
For example, if your company sells CRM software and a chatbot, you can cross-sell CRM customers with the chatbot, and chatbot customers with the CRM software. You can also upsell CRM customers with additional features such as applications, integrations, storage, and more.
“Simply put, an upsell is expanding or adding to an existing service/product, while a cross-sell is adding on additional or complementary services/products.
One may be more valuable than the other in your organization, but both should be an integral part of your overall strategy.”

– Jonathan Verstegen, Directive Account Executive
Customer Lifetime Value (LTV)
Customer lifetime value (LTV) is the total amount of revenue generated from the average individual customer over the lifetime of that average customer. To determine LTV, you must specify the gross profit of the average customer (AOV multiplied by GM%) and divide it by the average customer lifespan.
For subscription-based products, another way to calculate LTV is GM% multiplied by 1/monthly churn multiplied by monthly subscription revenue per customer.
LTV = GM% * (1/churn) * (Revenue/customer)
LTV is a powerful way to determine the efficiency of your business’s growth.
Revenue is a critical success metric for growth, as you need to be making money to grow your business. However, what about the number of sales or the number of customers? Why track those metrics as “sales-based success metrics”?
A well-known essay was written by Kevin Kelly back in 2008 called “1,000 True Fans”, and it maps out the importance of “true fans”. According to Kelly, “a true fan is defined as a fan that will buy anything you produce”.
For SaaS businesses, this works slightly differently, but the concept is the same.
You want to have a solid group of customers who continuously reinvest in your product. These are the customers who help maintain revenue streams and fuel growth.
Ultimately, they are the customers that help you maximize your LTV overall.
Customer Acquisition Cost (CAC)
Customer acquisition cost (CAC) is the cost associated with acquiring customers. This is an essential metric when calculating growth efficiency and scale. Calculate CAC by taking all of the expenses related to obtaining all customers and divide them by the total customers acquired.
CAC is most valuable when you can determine a value for every sales and marketing channel.
For example, if it takes you a total of $20,000 to acquire 50 customers through paid channels, but only costs you $10,000 to acquire 50 customers through organic search, then you might want to reallocate capital to organic channels to improve profitability at scale.
The best way for you to determine profitability, however, is incorporating the CAC and LTV metrics into a ratio – the LTV:CAC ratio.
LTV:CAC Ratio
The LTV:CAC ratio compares our LTV and CAC metrics and determines profitability and efficiency.
The value of your customer should be at least three times more valuable than the cost at which you acquired them (a ratio of 3:1).
If you are higher than 3:1, you are not spending enough money and most likely missing out on valuable revenue opportunities.
If you are lower than 3:1, you are overspending, and most likely need to improve your process of acquiring for those channels or need to reallocate capital to other channels.
This is a metric that you should be consistently tracking across all marketing channels. At Directive, we have found that this metric is the best way to determine what is “working” and what is not, from an efficiency and scale standpoint.
We have even built out a calculator that you can utilize for your own SaaS products, which you can find here: LTV:CAC Model for SaaS [Template].
How to effectively integrate these metrics into your growth strategy
When Directive works with SaaS clients, we focus on the metrics starting at the top-of-the-funnel (clicks, impressions, etc.) and make it all the way to revenue and growth metrics (sales, LTV, CAC, and more).
From a business standpoint, we can work with your team to identify what those LTV, CAC, churn, and other growth metrics are, and apply them to organic, paid, and other digital marketing channels that we influence.
From those metrics, we can find out what directly influenced them to be beneficial for your brand or what might be hindering your growth.
To effectively decide what our next step in our search marketing strategy is, we have to be able to analyze what worked and what did not.
Based on analyzing those conversion-based and sales-based metrics, we can identify exactly what content strategies worked (or did not work), what ad campaigns worked (or did not work), and more. We can take real insights and apply them to page-level analysis.
Using trends, we look at MoM and QoQ increases, identifying specific pages that are performing or not. From there, we utilize HotJar and other CRO tools to determine visual opportunities to improve conversion rates.
By taking this approach, your business can get granular insights on your marketing, whether that be through search, social media, events, or something creative and new.
Are you ready to see real growth and discoverability for your brand? See what we can do for you.
Review our case studies today.